Daily Top Trade Setups: Advanced Forex, Indices, Commodities, and Stock Analysis
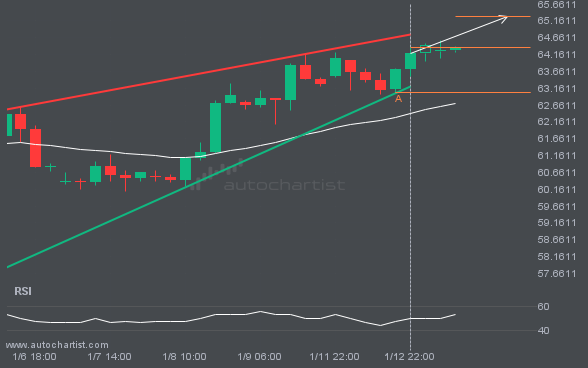
BRN/USD is approaching a resistance line of a Rising Wedge. It has touched this line numerous times in the last 8 days.
BRN/USD is moving toward a resistance line. Since it has retraced from this line before, we may see either a breakout through it or a rebound to current levels. It has touched this line multiple times in the past 8 days and may test it again within the next 21 hours.
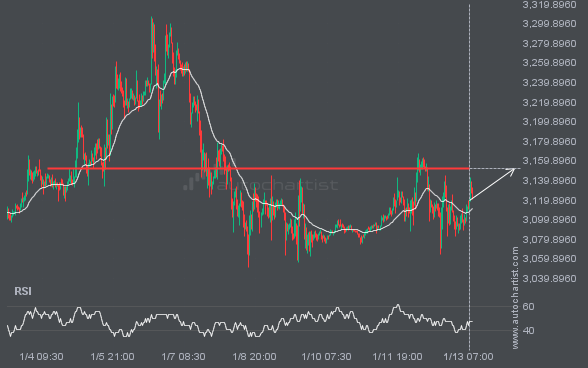
ETHUSD is heading toward a price it has tested 6 times recently.
ETHUSD is approaching a critical level that could be a key deciding factor for what comes next. We may see this trajectory continue to test and break through 3152.2700, unless it loses momentum and pulls back to current levels.
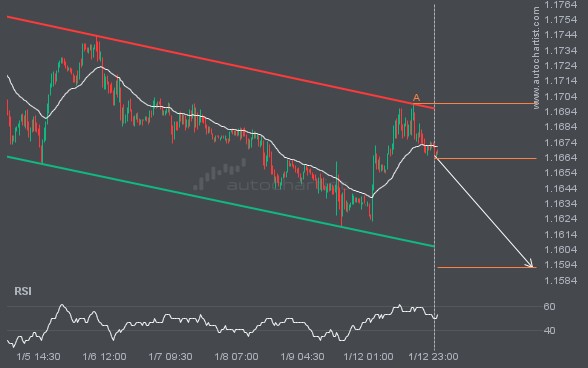
An important support line is being approached by EURUSD. This price has been tested numerous times in the last 11 days
An emerging Channel Down pattern in its final wave has been identified on the EURUSD 30 Minutes chart. After a strong bearish run, EURUSD is heading toward the upper triangle trendline, with possible resistance at 1.1592. If the support holds, the Channel Down pattern suggests a rebound toward current levels.
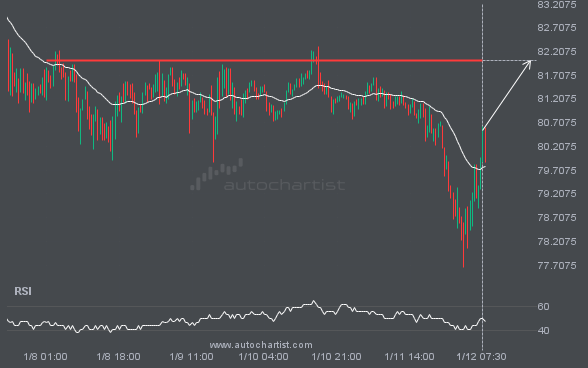
If you’re short on LTCUSD, be aware of the rapidly approaching level at 82.0100.
LTCUSD is about to retest a key horizontal resistance level near 82.0100. It has tested this level 5 times recently and may simply bounce off it, as it did last time. However, after so many attempts, it may be ready to start a new trend.
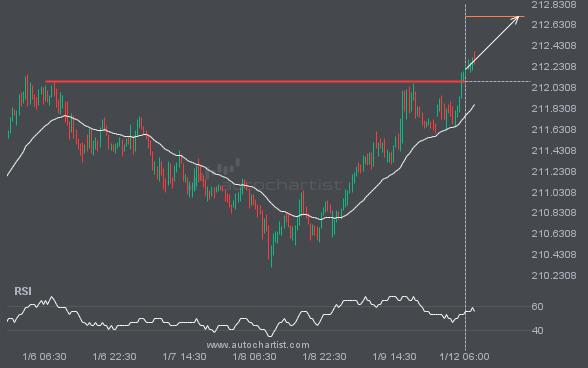
GBPJPY – breach of a price line that has been tested numerous times before
GBPJPY has broken through a resistance line. Since it has previously retraced from this price, wait for confirmation of the breakout before trading. It has touched this line several times over the past 6 days. This suggests a possible target around 212.7108 within the next 21 hours.
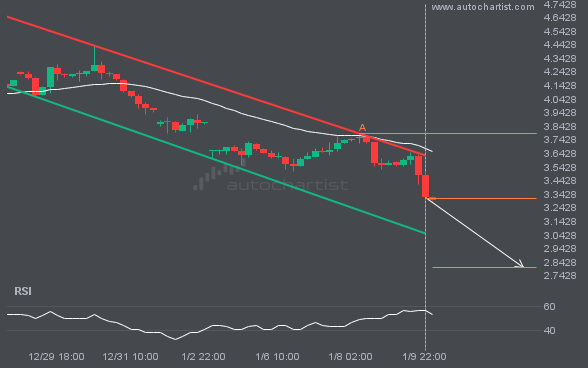
An important support line is being approached by NGC/USD. This price has been tested numerous times in the last 15 days
NGC/USD is moving toward a support line. Since it has retraced from this line before, we may see either a breakout through this line or a rebound to current levels. It has touched this line numerous times in the last 15 days and may test it again within the next 3 days.
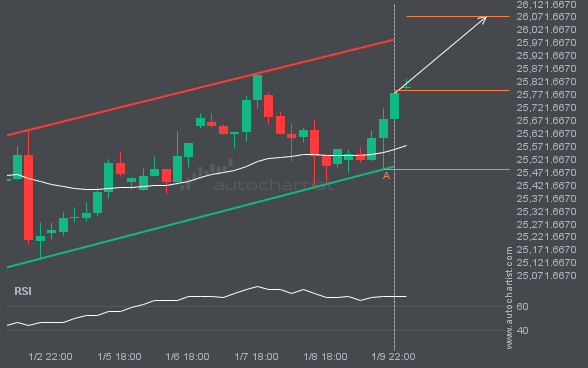
Consider a move on NAS100 as it heads toward resistance.
NAS100 is heading toward the resistance line of a Channel Up pattern and could reach it within the next 2 days. It has tested this line numerous times before, and this time may be no different, ending in a rebound instead of a breakout. If a breakout doesn’t occur, we could see a retracement back […]
Latest company news, corporate actions and partnership announcements
Interesting trading articles, ideas, and thought leadership
Ask your broker today or sign up for a demo from the Technical Analysis page.