 Skip to content
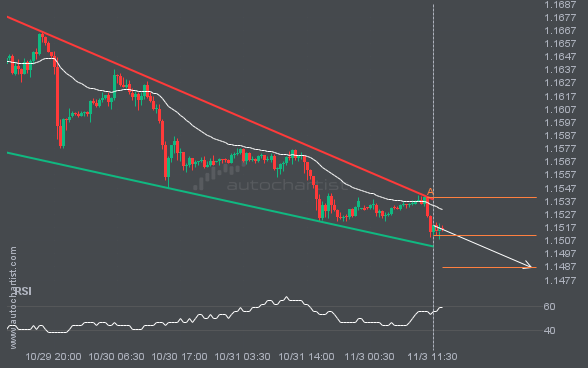
 EURUSD is moving towards a support line. Because we have seen it retrace from this line before, we could see either a break through this line, or a rebound back to current levels. It has touched this line numerous times in the last 6 days and may test it again within the next 19 hours.
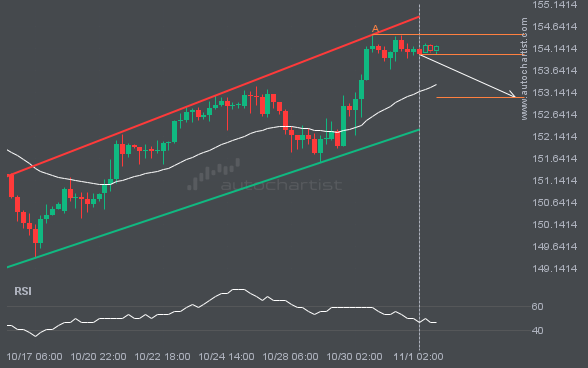
USDJPY is moving towards a support line. Because we have seen it retrace from this line before, we could see either a break through this line, or a rebound back to current levels. It has touched this line numerous times in the last 19 days and may test it again within the next 2 days.
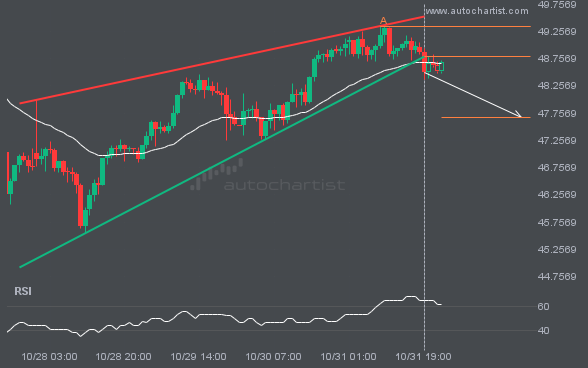
XAGUSD has broken through a support line of a Rising Wedge and suggests a possible movement to 47.6817 within the next 2 days. It has tested this line in the past, so one should probably wait for a confirmation of this breakout before taking action. If the breakout doesn’t confirm, we could see a retracement […]
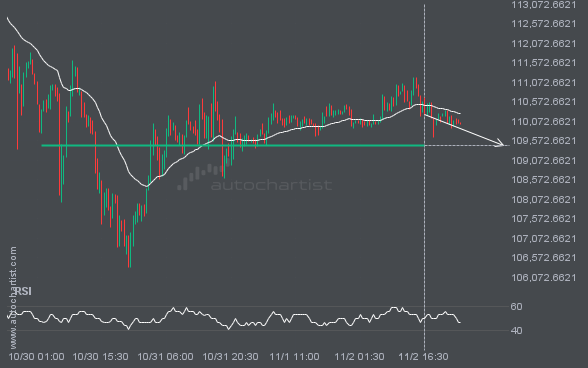
BTCUSD is moving towards a support line. Because we have seen it retrace from this level in the past, we could see either a break through this line, or a rebound back to current levels. It has touched this line numerous times in the last 4 days and may test it again within the next […]
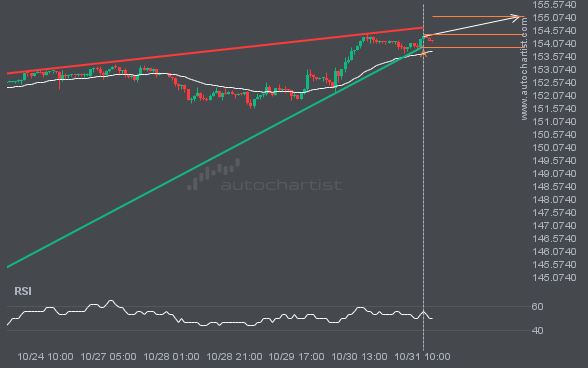
An emerging Rising Wedge has been detected on USDJPY on the 1 hour chart. There is a possible move towards 155.0917 next few candles. Once reaching support it may continue its bullish run or reverse back to current price levels.

XAGUSD is heading towards the resistance line of a Rising Wedge. If this movement continues, the price of XAGUSD could test 49.5418 within the next 13 hours. It has tested this line numerous times in the past, so this movement could be short-lived and end up rebounding just like it did in the past.


