Skip to content
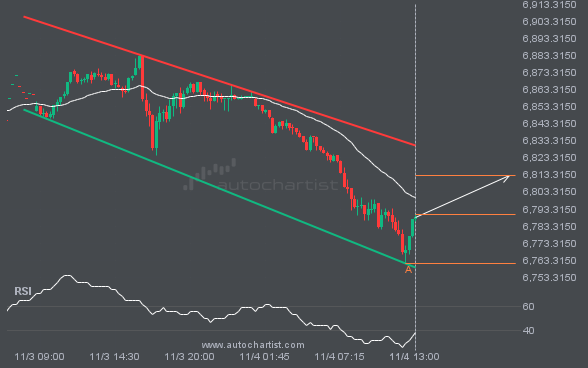
 Emerging Channel Down pattern in its final wave was identified on the GBPJPY 4 hour chart. After a strong bearish run, we find GBPJPY heading towards the upper triangle line with a possible resistance at 199.0134. If the support shows to hold, the Channel Down pattern suggests a rebound back towards current levels.
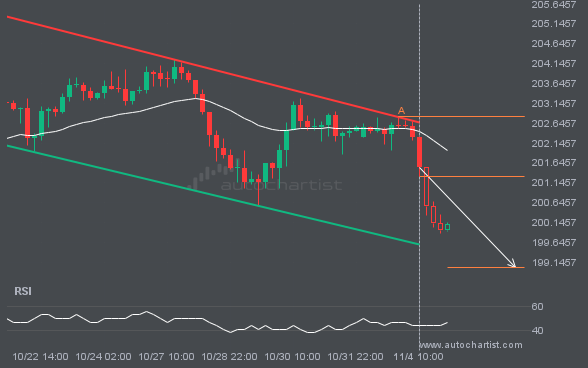
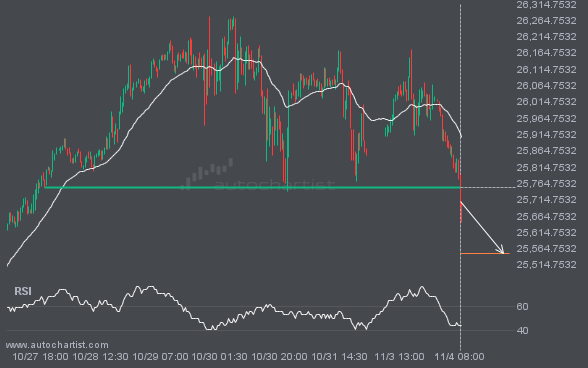
S&P500 is moving towards a resistance line which it has tested numerous times in the past. We have seen it retrace from this line before, so at this stage it isn’t clear whether it will breach this line or rebound as it did before. If S&P500 continues in its current trajectory, we could see it […]
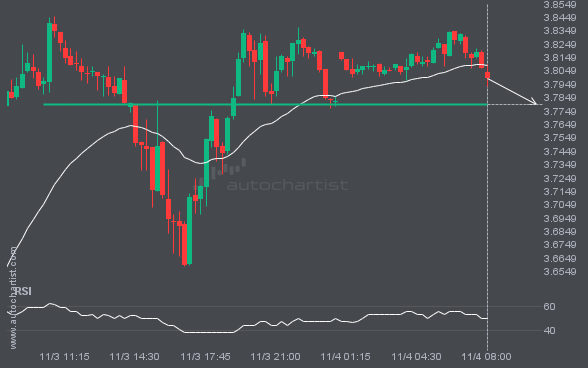
LTCUSD is moving towards a support line. Because we have seen it retrace from this line before, we could see either a break through this line, or a rebound back to current levels. It has touched this line numerous times in the last 2 days and may test it again within the next 11 hours.
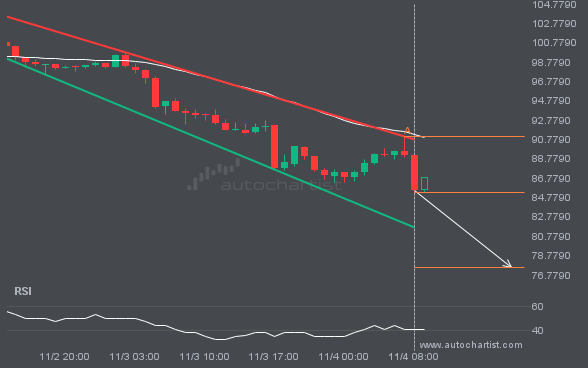
NAS100 has broken through a support line. Because we have seen it retrace from this price in the past, one should wait for confirmation of the breakout before trading. It has touched this line numerous times in the last 8 days and suggests a possible target level to be around 25550.7305 within the next 2 […]
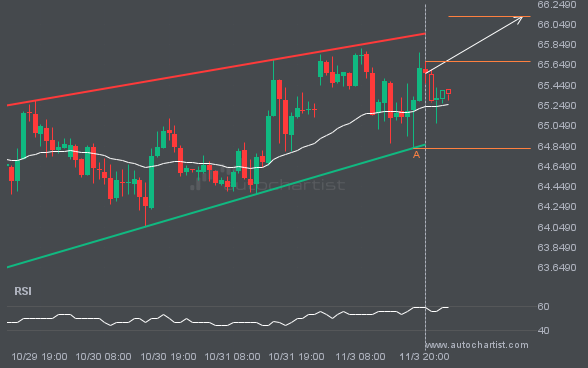
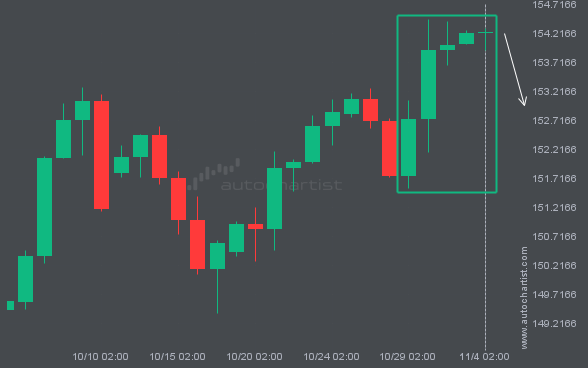
Emerging Rising Wedge detected on BRN/USD – the pattern is an emerging one and has not yet broken through support, but the price is expected to move up over the next few hours. The price at the time the pattern was found was 65.6865 and it is expected to move to 66.1253.