Skip to content
 XAUUSD is approaching a support line at 3991.7000. If it hits the support line, it may break through this level to continue the bearish trend, or it may return to current levels.

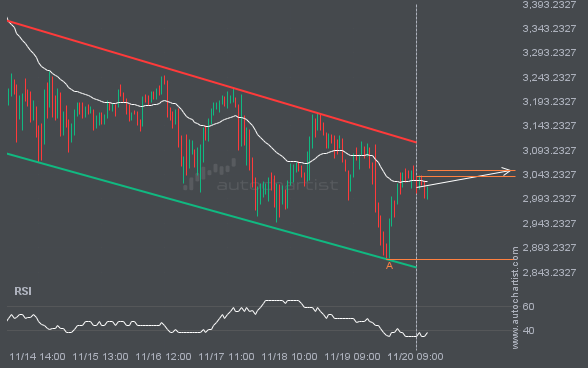
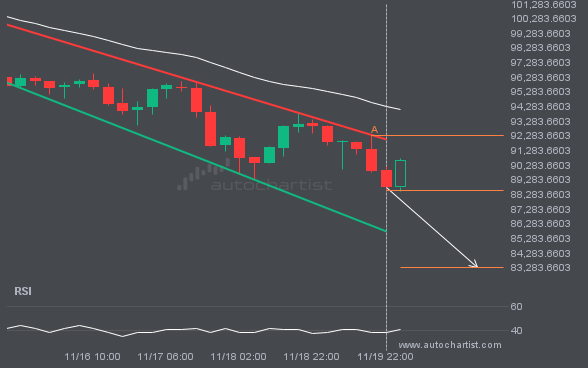
ETHUSD is trapped in a Channel Down formation, implying that a breakout is imminent. This is a strong trade setup for both trend and swing traders. It is now approaching a support line that has been tested before. Divergence watchers may be optimistic about a potential breakout, which could mark the start of a new […]
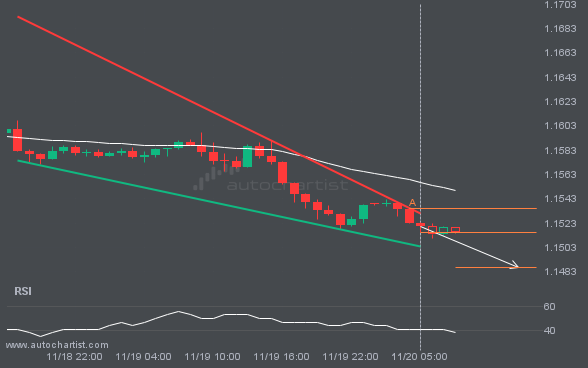
EURUSD is moving toward a support line it has tested many times. It has retraced from this line before, so it’s unclear whether it will break through or rebound again. If EURUSD continues on its current trajectory, it could reach 1.1487 within the next 7 hours.
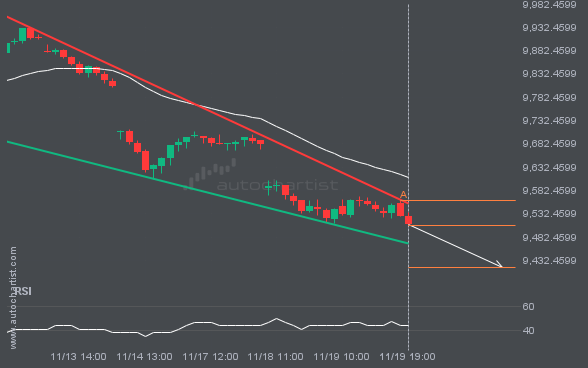
FTSE100 is heading toward the support line in a Falling Wedge pattern. If this move continues, the price of FTSE100 could test 9417.4226 within the next 15 hours. It has tested this line many times before, so the move could be short-lived and may rebound as it has before.
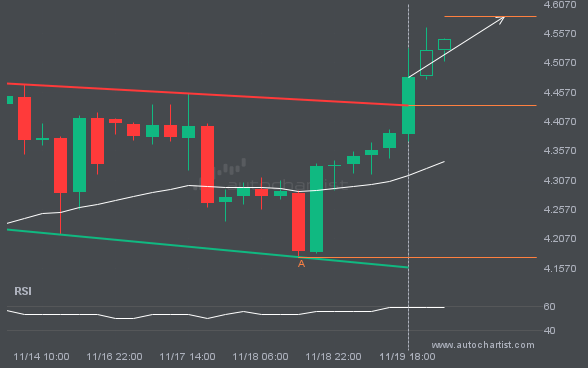
NGC/USD has moved through the resistance line of a Flag pattern at 4.433833333333334 on the 4 hour chart. This line has been tested multiple times in the past, and this breakout could signal an upcoming change in the current trend. Price may continue in the current direction toward 4.5856.
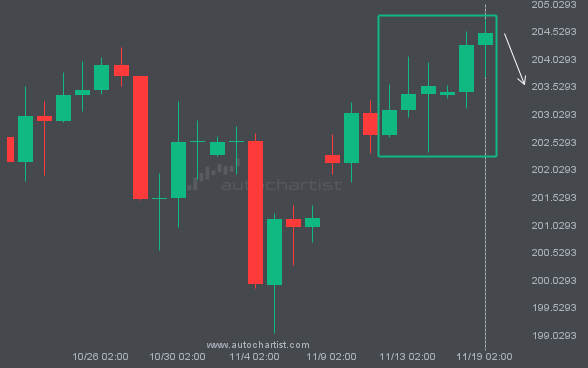
BTCUSD is moving toward a support line. Since it has retraced from this line before, we may see either a breakout through it or a rebound to current levels. It has touched this line multiple times in the past 5 days and may test it again within the next 2 days.