Skip to content
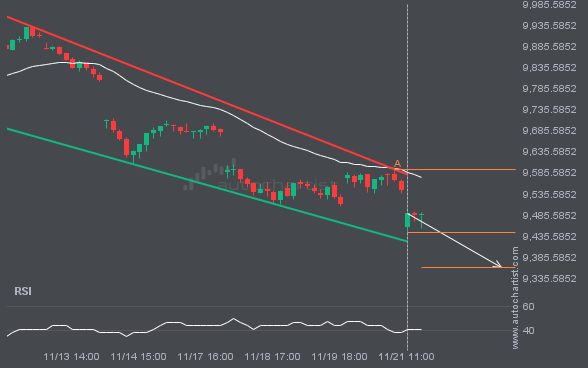
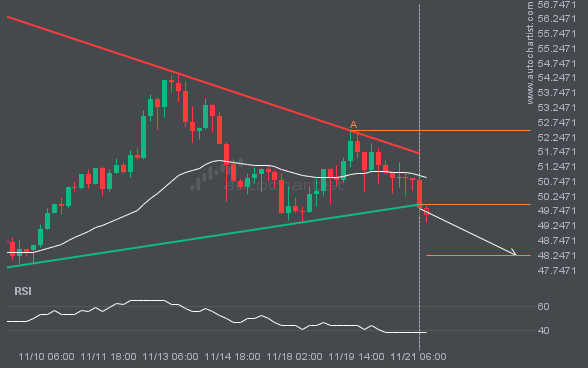
FTSE100 is trapped in a Channel Down formation, implying that a breakout is imminent. This is a strong trade setup for both trend and swing traders. It is now approaching a resistance line that has been tested before. Divergence watchers may be optimistic about a potential breakout, which could mark the start of a new […]
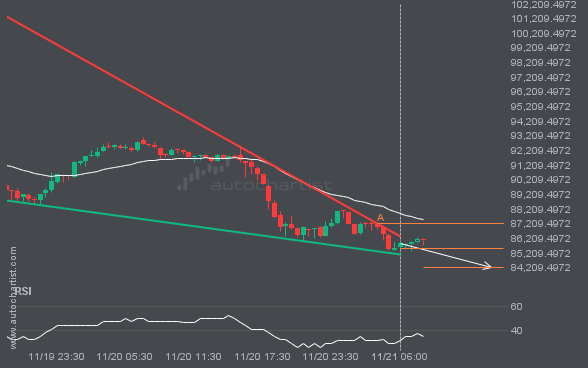
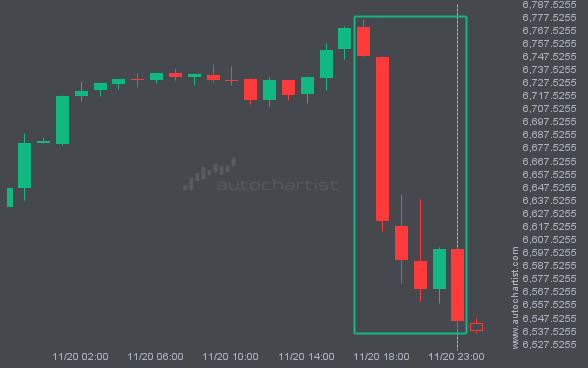
BTCUSD was identified around 85501.04 after recently rebounding off the resistance on the 30 Minutes interval. Ultimately, the stock’s price action has formed a Falling Wedge pattern. This squeeze may increase the chances of a strong breakout. The projected move could take the price to around 84241.2217.
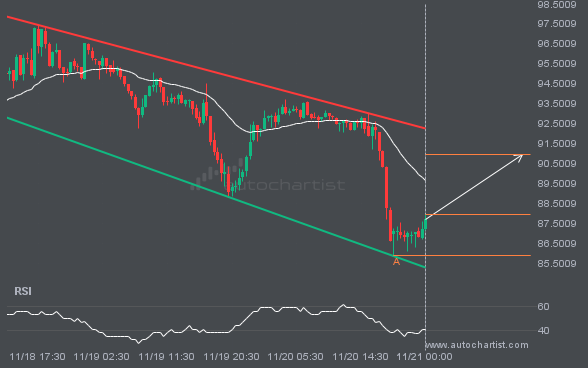
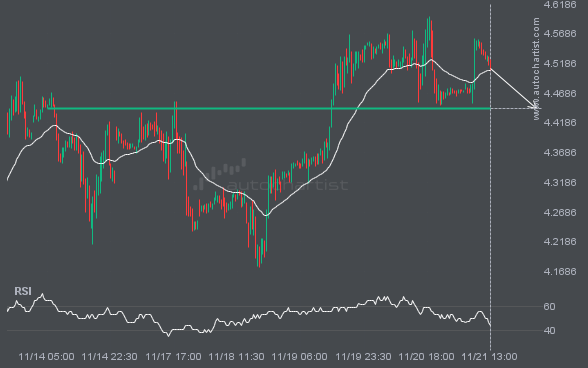
LTCUSD is moving toward a resistance line it has tested many times. It has retraced from this line before, so it’s unclear whether it will break through or rebound again. If LTCUSD continues on its current trajectory, it could reach 90.9541 within the next 17 hours.