Skip to content
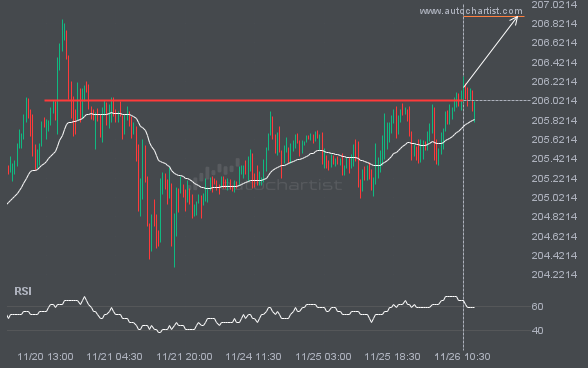
 GBPJPY has broken through a resistance line. Because it has previously retraced from this price, you should wait for confirmation of the breakout before trading. It has touched this line multiple times over the past 6 days, which suggests a possible target around 206.8916 within the next 20 hours.
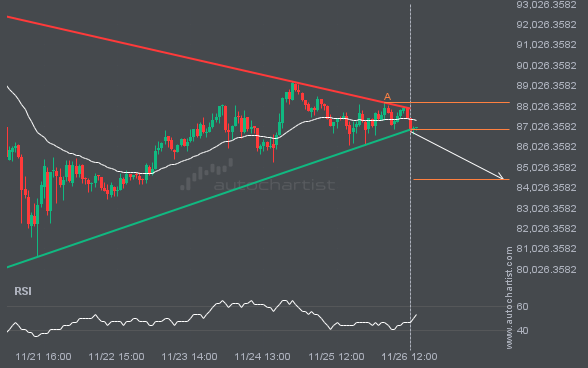
BTCUSD has broken through a support line of the Triangle chart pattern. If this breakout holds, we may see the price of BTCUSD test 84439.7459 within the next 2 days. But don’t rush to trade. It has tested this line before, so confirm the breakout before taking any action.
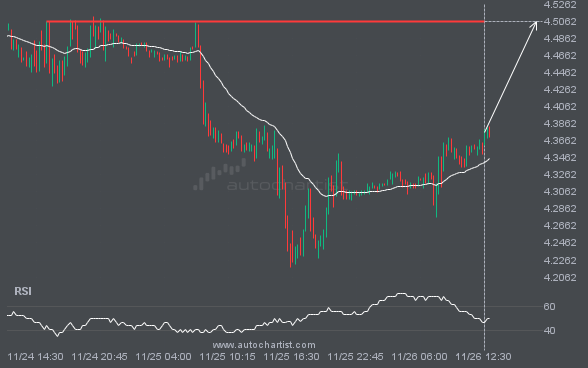
A strong resistance level has been identified at 4.5055 on the 15 Minutes NGC/USD chart. NGC/USD is likely to test this level soon.

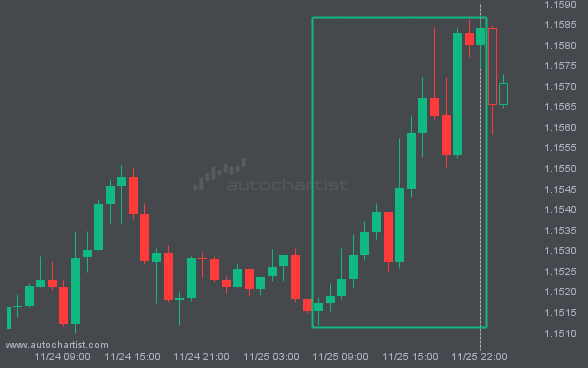
FTSE100 has broken through a line at 9604.7500. If this breakout holds, we could see the price of FTSE100 move toward 9659.9902 within the next 12 hours. However, don’t be too quick to trade. It has tested this line many times in the past, so confirm the breakout before placing any trades.
XAUUSD is moving toward a support line. Since it has retraced from this line before, we may see either a breakout through it or a rebound to current levels. It has touched this line multiple times in the past 5 days and may test it again within the next 17 hours.

The price of USDJPY is heading toward 155.8160. Despite the recent breakout through 156.4650, it may struggle to gain momentum to reach the forecast price and could move back in the other direction. This has happened many times in the past, so watch for a possible bounce back.