Skip to content
 BTCUSD is moving toward a level at 90651.3125, which it has tested many times before. We have seen it retrace from this level before, so at this stage it isn’t clear whether it will break through this price or rebound again. If BTCUSD continues on its current trajectory, we may see it move toward 90651.3125 […]

BTCUSD is heading toward 92450.9219 and could reach this level within the next 3 days. It has tested this level numerous times in the past, and this time could be no different, ending in a rebound rather than a breakout. If a breakout does not occur, we may see a retracement back to current levels.
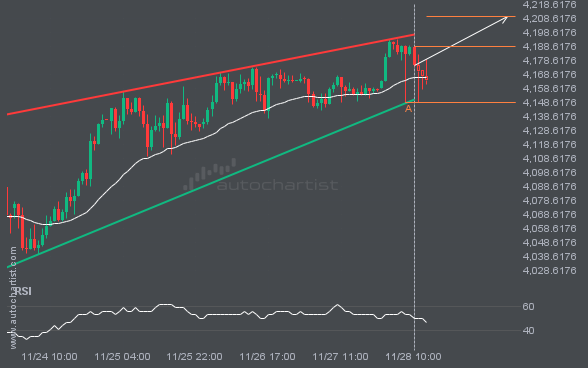
The movement of XAUUSD toward the resistance line of a Rising Wedge is yet another test of the line it has reached numerous times in the past. This test of the line could occur within the next 2 days, but it is uncertain whether it will result in a breakout through this line or simply […]
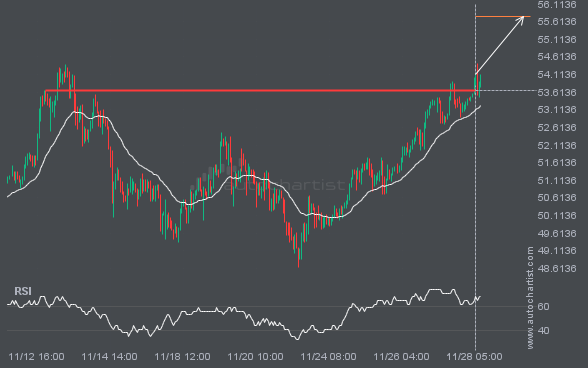
XAGUSD has broken through a resistance line. Since it has previously retraced from this price, wait for confirmation of the breakout before trading. It has touched this line several times over the past 16 days. This suggests a possible target around 55.7579 within the next 3 days.