Daily Top Trade Setups: Advanced Forex, Indices, Commodities, and Stock Analysis
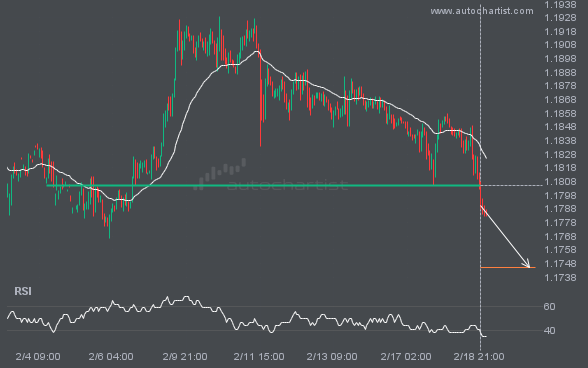
A breach of 1.1805 could signal the start of a bearish trend in EURUSD.
A strong support level has been breached at 1.1805 on the 1 hour EURUSD chart. Technical analysis forecasts a move to 1.1745 within the next 2 days.
An important support line is being approached by LTCUSD. This price has been tested numerous times in the last 3 days
LTCUSD is trapped in a Falling Wedge formation, implying that a breakout is imminent. This is a strong trade setup for both trend and swing traders. It is now approaching a resistance line that has been tested before. Divergence watchers may be optimistic about a potential breakout, which could mark the start of a new […]
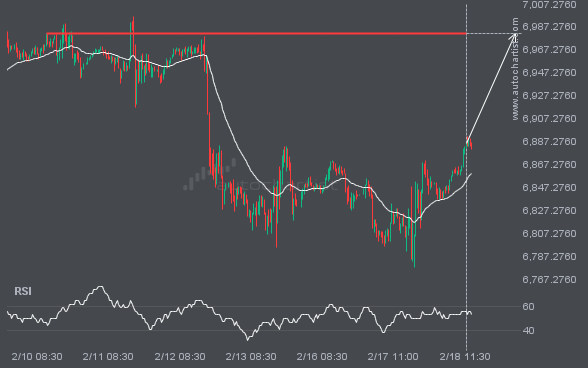
S&P500 appears to be approaching resistance—a potential opportunity?
S&P500 is heading toward 6982.0000 and could reach this level within the next 2 days. It has tested this level numerous times in the past, and this time could be no different, ending in a rebound rather than a breakout. If a breakout does not occur, we may see a retracement back to current levels.
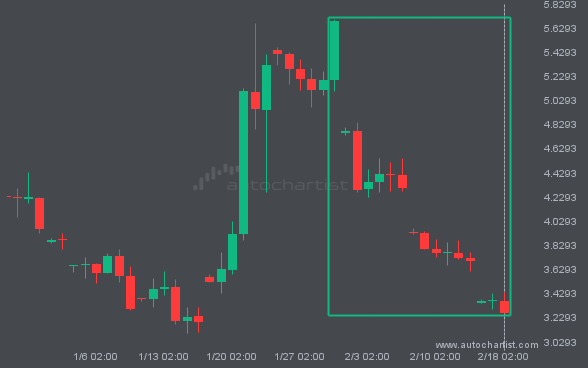
NGC/USD reached 3.2645 after a move of 42.59% spanning 20 days.
NGC/USD reached 3.2645 after a 42.59% move spanning 20 days.
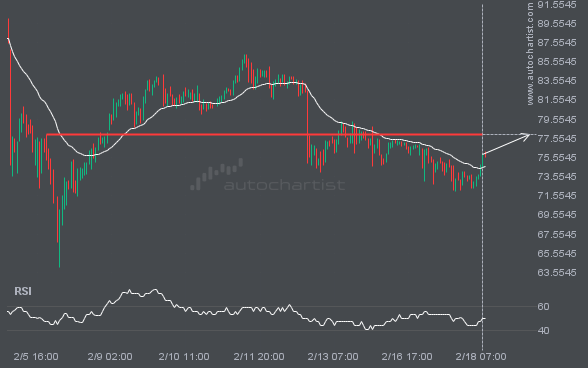
XAGUSD is likely to test 77.8975 in the near future. Where to next?
XAGUSD is moving toward a level at 77.8975, which it has tested many times before. We have seen it retrace from this level before, so at this stage it isn’t clear whether it will break through this price or rebound again. If XAGUSD continues on its current trajectory, we may see it move toward 77.8975 […]
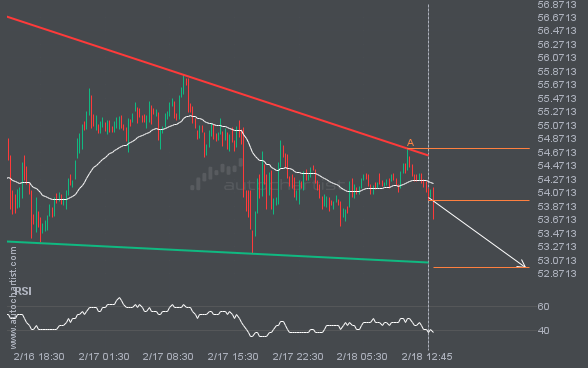
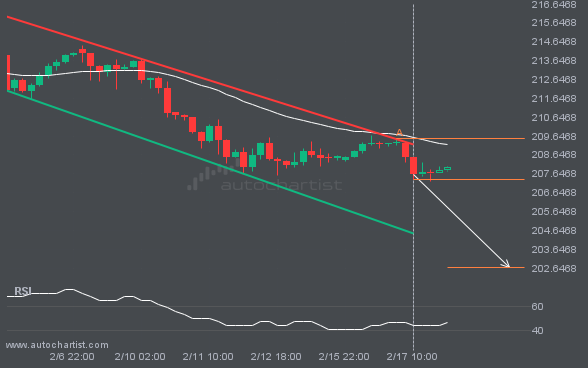
Because GBPJPY has formed a Channel Down pattern, we expect it to touch the support line. If it breaks through the support, it may move much lower.
GBPJPY is moving toward a support line. Since it has retraced from this line before, we may see either a breakout through this line or a rebound to current levels. It has touched this line numerous times in the last 13 days and may test it again within the next 2 days.
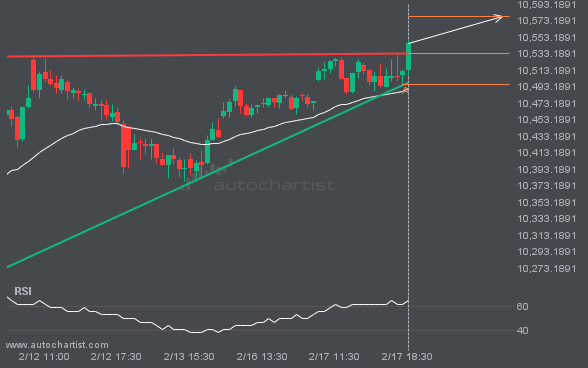
An interesting opportunity in FTSE100 after breaking 10532.648153846154.
A breakout of FTSE100 through the resistance line of a Ascending Triangle could signal what’s ahead. If the breakout persists, we may see FTSE100’s price test 10577.9882 within the next 10 hours.
Latest company news, corporate actions and partnership announcements
Interesting trading articles, ideas, and thought leadership
Ask your broker today or sign up for a demo from the Technical Analysis page.