 Skip to content
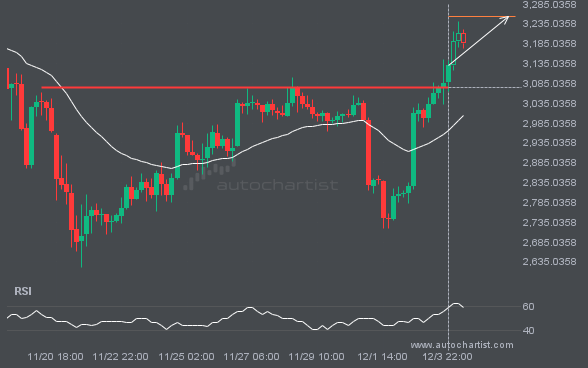
 ETHUSD has broken through a level at 3075.0200, suggesting a possible move to 3253.4170 within the next 3 days. It has tested this level numerous times in the past, so you should wait for confirmation of this breakout before taking any action. If the breakout does not confirm, we could see a retracement back to […]
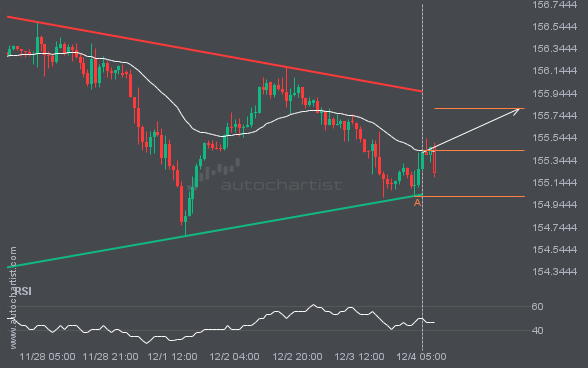
USDJPY is heading toward the resistance line of a Triangle pattern and could reach it within the next 2 days. It has tested this line numerous times before, and this time may be no different, ending in a rebound instead of a breakout. If a breakout doesn’t occur, we could see a retracement back to […]
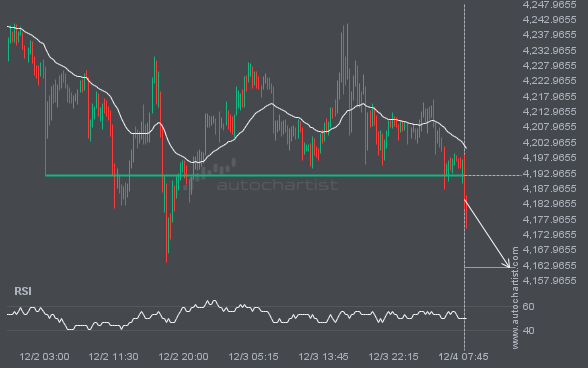
XAUUSD has broken through a level at 4192.1299, suggesting a possible move to 4162.2744 within the next 12 hours. It has tested this level numerous times in the past, so you should wait for confirmation of this breakout before taking any action. If the breakout does not confirm, we could see a retracement back to […]
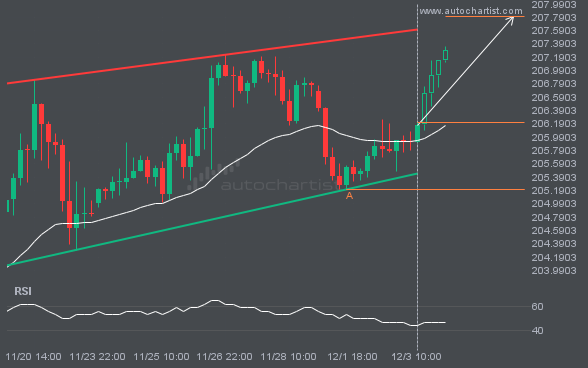
S&P500 is moving toward a resistance line. Since it has retraced from this line before, we may see either a breakout through it or a rebound to current levels. It has touched this line multiple times in the past 16 days and may test it again within the next 3 days.
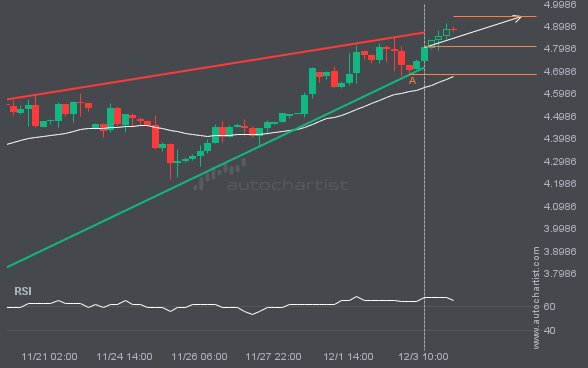
LTCUSD is moving toward a resistance line. Since it has retraced from this line before, we may see either a breakout through it or a rebound to current levels. It has touched this line multiple times in the past 3 days and may test it again within the next 18 hours.
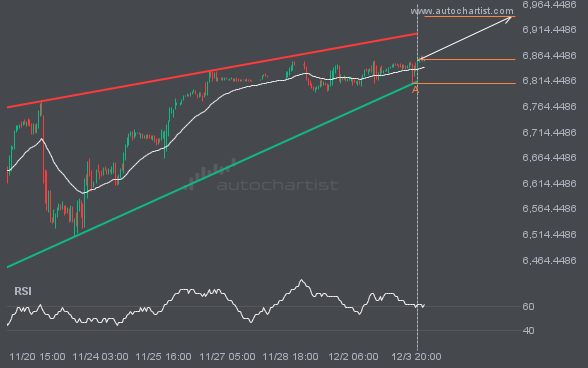
NGC/USD is trapped in a Rising Wedge formation, implying that a breakout is imminent. This is a strong trade setup for both trend and swing traders. It is now approaching a support line that has been tested before. Divergence watchers may be optimistic about a potential breakout, which could mark the start of a new […]
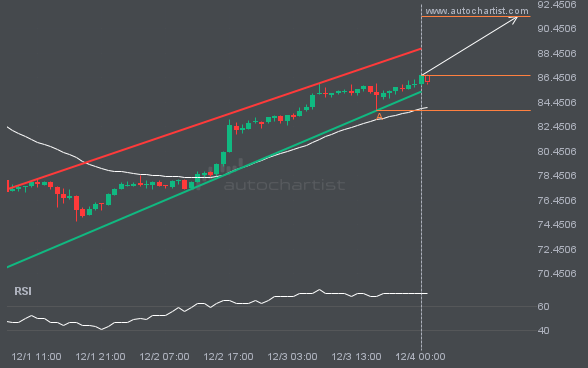
GBPJPY is heading toward the resistance line of a Channel Up pattern and could reach it within the next 3 days. It has tested this line numerous times before, and this time may be no different, ending in a rebound instead of a breakout. If a breakout doesn’t occur, we could see a retracement back […]

