 Skip to content
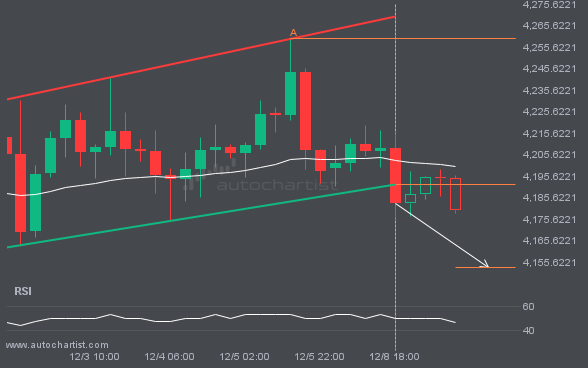
 The last 8 4 hour candles on XAUUSD have formed a Flag pattern and broken out through the pattern lines, indicating a possible bearish movement toward the price level at 4153.1840.
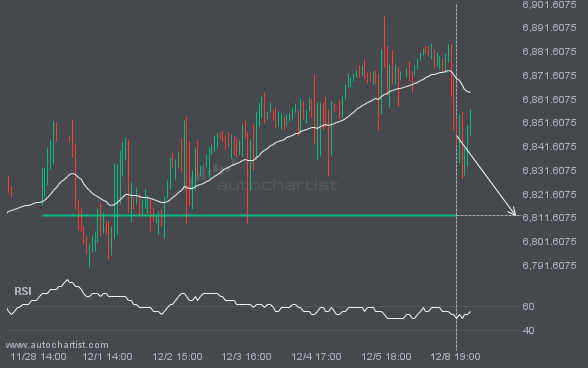
The price of S&P500 is heading back toward the support area. It may struggle to break through and could reverse direction. The price may eventually break through, but it typically retreats from the level several times before doing so.
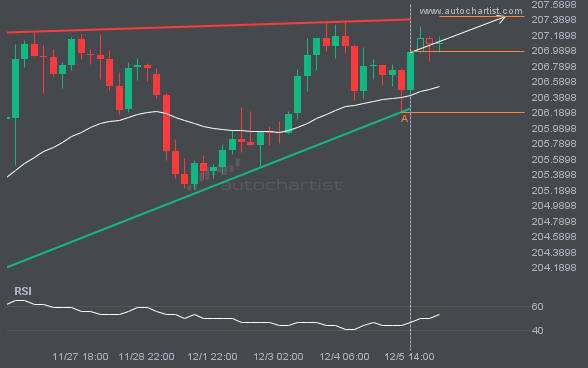
GBPJPY is heading toward the resistance line in a Ascending Triangle pattern. If this move continues, the price of GBPJPY could test 207.4282 within the next 2 days. It has tested this line many times before, so the move could be short-lived and may rebound as it has before.
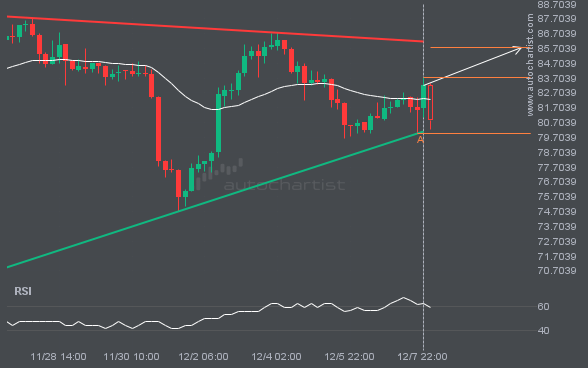
The movement of LTCUSD toward the resistance line of a Triangle is yet another test of the line it has reached numerous times in the past. This test of the line could occur within the next 4 days, but it is uncertain whether it will result in a breakout through this line or simply rebound […]
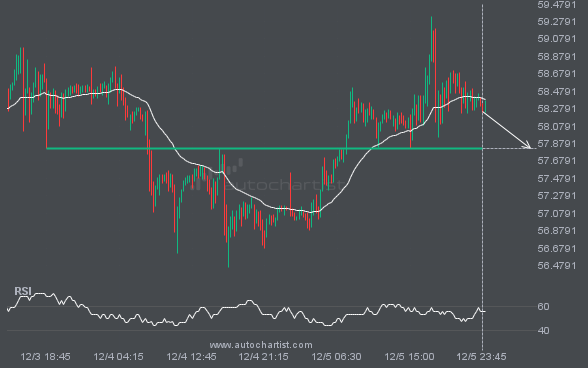
XAGUSD is approaching a critical level that could be a key deciding factor for what comes next. We may see this trajectory continue to test and break through 57.8255, unless it loses momentum and pulls back to current levels.
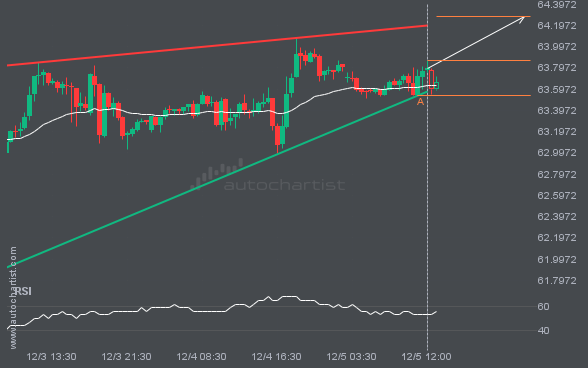
BRN/USD is moving toward a resistance line. Since it has retraced from this line before, we may see either a breakout through this line or a rebound to current levels. It has touched this line numerous times in the last 3 days and may test it again within the next 12 hours.


