 Skip to content
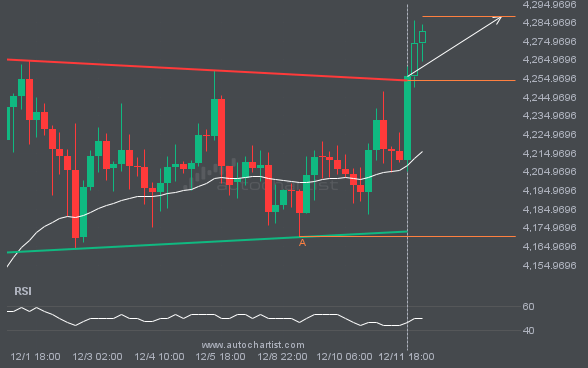
Rectangle pattern identified on XAUUSD has broken through a resistance level, with price momentum continuing to move upward. This presents a solid trading opportunity, with the price expected to reach 4288.2445 in the next 3.
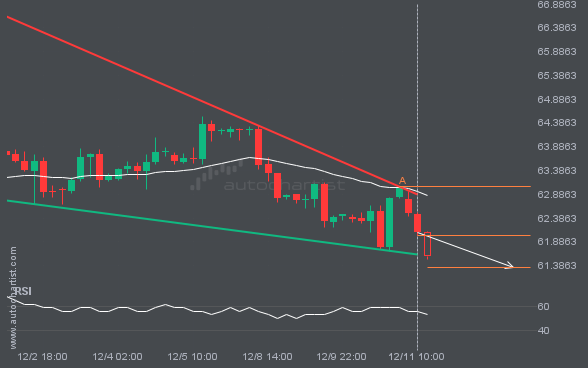
BRN/USD is moving toward a support line. Since it has retraced from this line before, we may see either a breakout through it or a rebound to current levels. It has touched this line multiple times in the past 11 days and may test it again within the next 3 days.
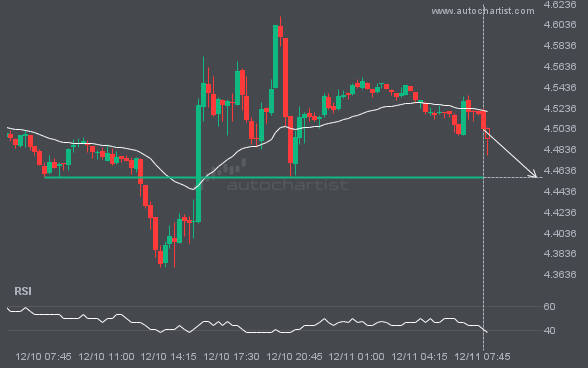
NGC/USD is approaching the line at 4.4565. If this move continues, the price of NGC/USD could test 4.4565 within the next 5 hours. But do not rush to trade. It has tested this line many times in the past, so the move could be short-lived and end in a rebound.
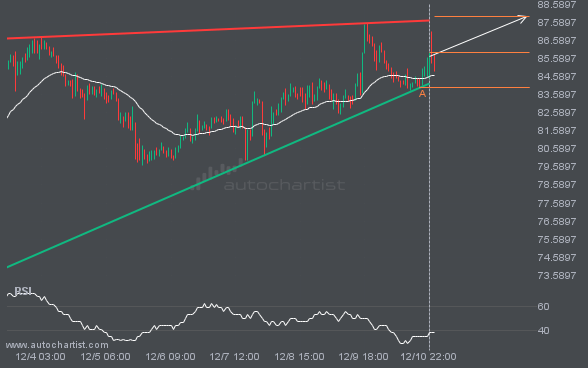
XAGUSD is moving toward a resistance line. Since it has retraced from this line before, we may see either a breakout through it or a rebound to current levels. It has touched this line multiple times in the past 3 days and may test it again within the next 19 hours.
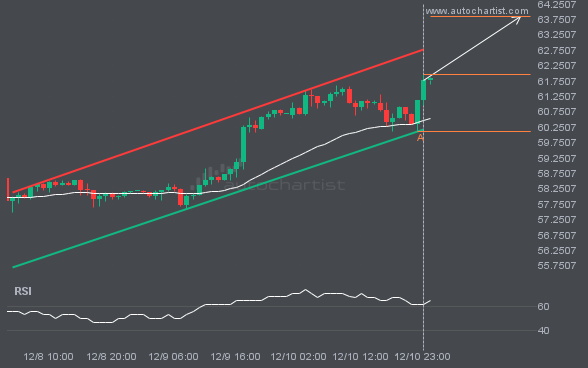
LTCUSD is trapped in a Rising Wedge formation, implying that a breakout is imminent. This is a strong trade setup for both trend and swing traders. It is now approaching a support line that has been tested before. Divergence watchers may be optimistic about a potential breakout, which could mark the start of a new […]
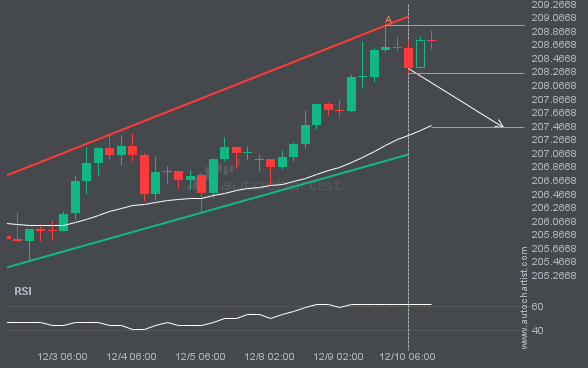
GBPJPY was identified around 208.2395 after recently rebounding off the resistance on the 4 hour interval. Ultimately, the stock’s price action has formed a Channel Up pattern. This squeeze may increase the chances of a strong breakout. The projected move could take the price to around 207.4464.


