Skip to content
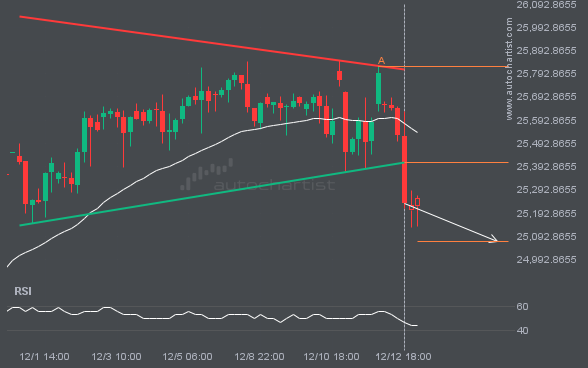
 NAS100 has moved through the support line of a Triangle pattern at 25410.605817647058 on the 4 hour chart. This line has been tested multiple times in the past, and this breakout could signal an upcoming change in the current trend. Price may continue in the current direction toward 25071.0980.
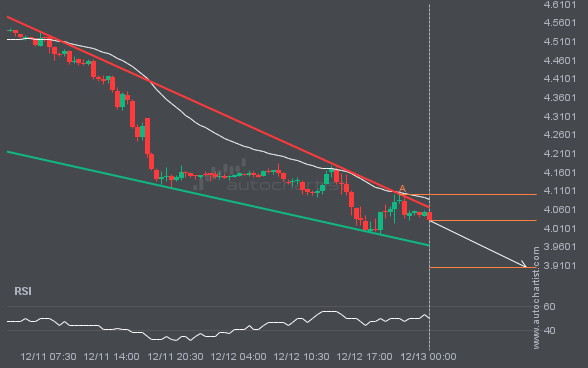
NGC/USD is moving toward a support line. Since it has retraced from this line before, we may see either a breakout through it or a rebound to current levels. It has touched this line multiple times in the past 3 days and may test it again within the next 13 hours.

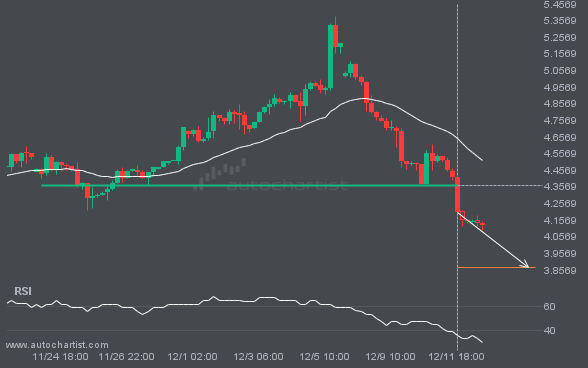
BTCUSD has broken through a support line. Because it has previously retraced from this price, you should wait for confirmation of the breakout before trading. It has touched this line multiple times over the past 9 days, which suggests a possible target around 86754.8516 within the next 2 days.
The breakout of NGC/USD through the 4.3665 price line is a breach of an important psychological price level that it has tested numerous times in the past. If this breakout persists, NGC/USD could test 3.8732 within the next 3 days. One should always be cautious before placing a trade and wait for confirmation of the […]
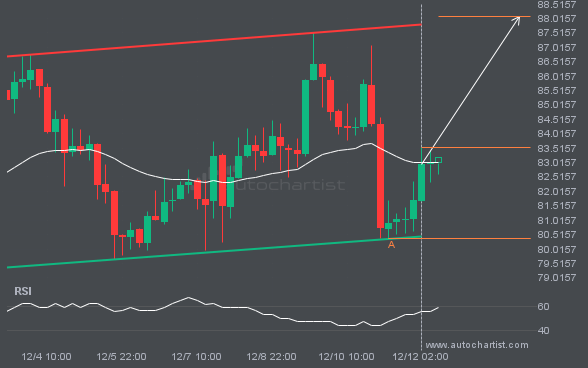
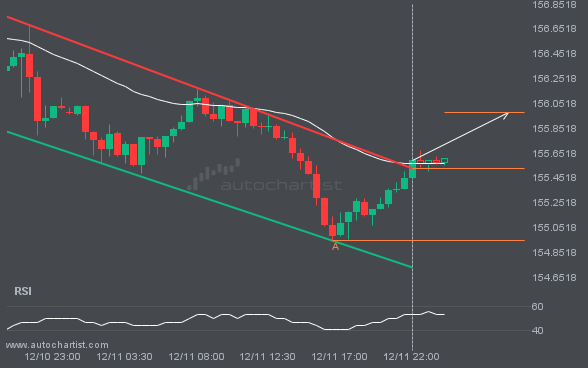
LTCUSD was identified around 83.53 after recently rebounding off the support on the 4 hour interval. Ultimately, the stock’s price action has formed a Channel Up pattern. This squeeze may increase the chances of a strong breakout. The projected move could take the price to around 88.0805.