Skip to content
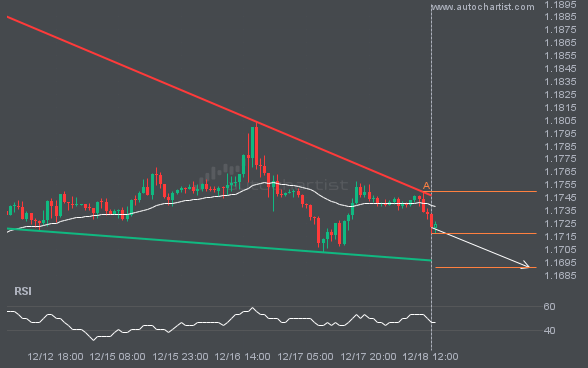
 EURUSD is moving toward a support line it has tested many times. It has retraced from this line before, so it’s unclear whether it will break through or rebound again. If EURUSD continues on its current trajectory, it could reach 1.1691 within the next 2 days.
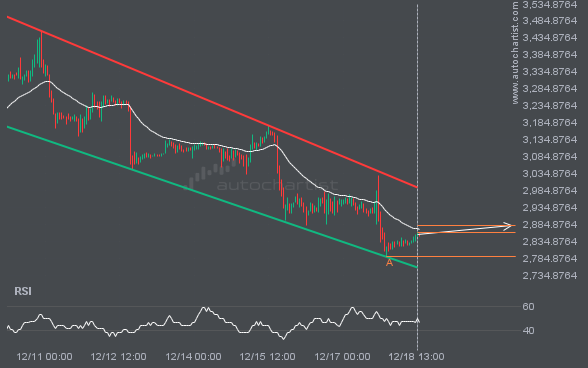
ETHUSD is moving toward a resistance line. Since it has retraced from this line before, we may see either a breakout through it or a rebound to current levels. It has touched this line multiple times in the past 11 days and may test it again within the next 3 days.

BRN/USD is once again retesting a key horizontal support level at 59.8610. This level has been tested 4 times recently and could see another bounce, as it did last time. However, after so many attempts, it may be ready to start a new trend.
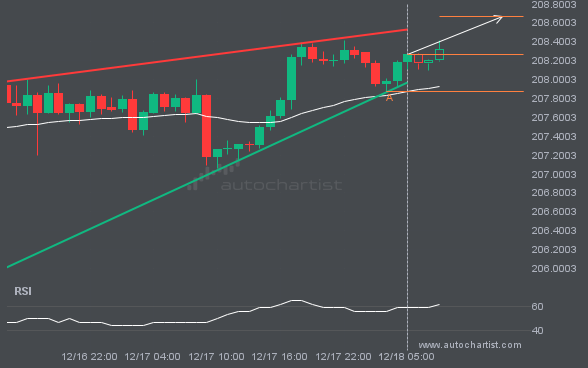
GBPJPY is moving toward a resistance line. Since it has retraced from this line before, we may see either a breakout through this line or a rebound to current levels. It has touched this line numerous times in the last 2 days and may test it again within the next 8 hours.
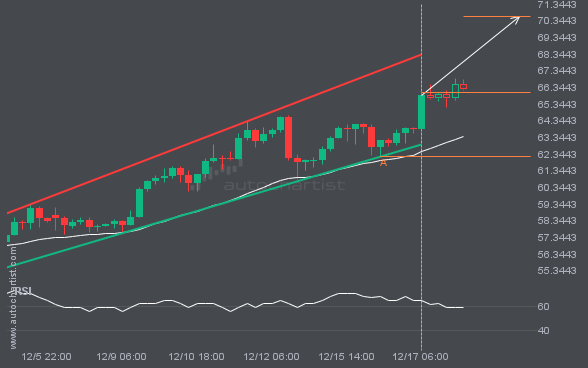
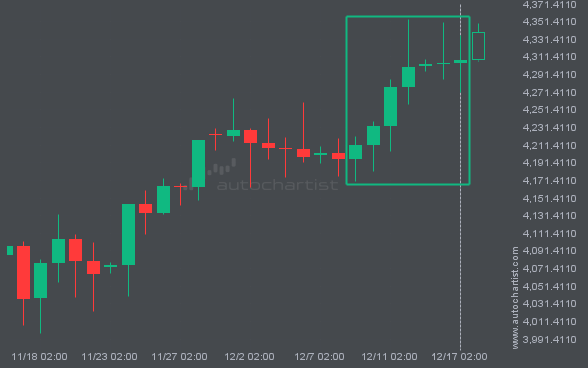
XAGUSD is heading toward the resistance line of a Channel Up pattern and could reach it within the next 2 days. It has tested this line numerous times before, and this time may be no different, ending in a rebound instead of a breakout. If a breakout doesn’t occur, we could see a retracement back […]
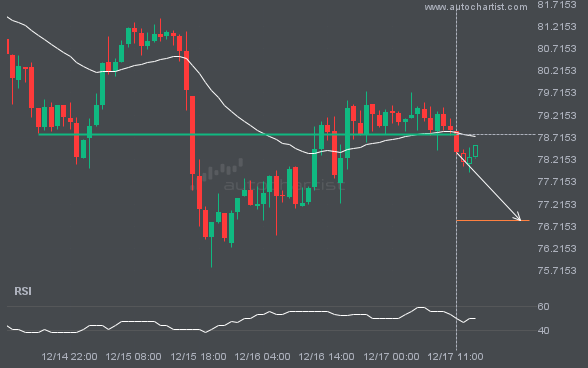
LTCUSD has broken through a level at 78.7800, suggesting a possible move to 76.8490 within the next 13 hours. It has tested this level numerous times in the past, so you should wait for confirmation of this breakout before taking any action. If the breakout does not confirm, we could see a retracement back to […]