Skip to content
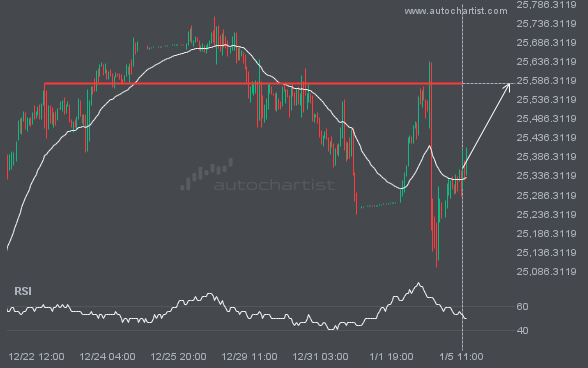
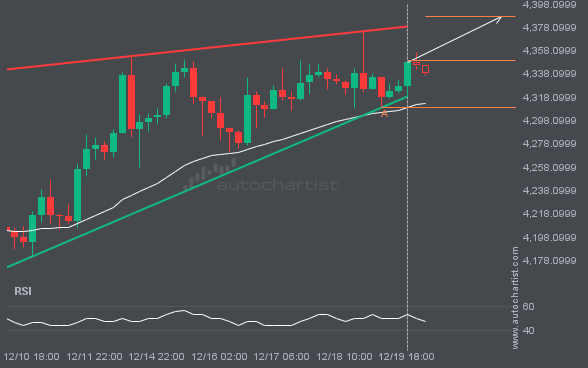
 FTSE100 is moving toward a resistance line. Since it has retraced from this line before, we may see either a breakout through it or a rebound to current levels. It has touched this line multiple times in the past 21 days and may test it again within the next 20 hours.
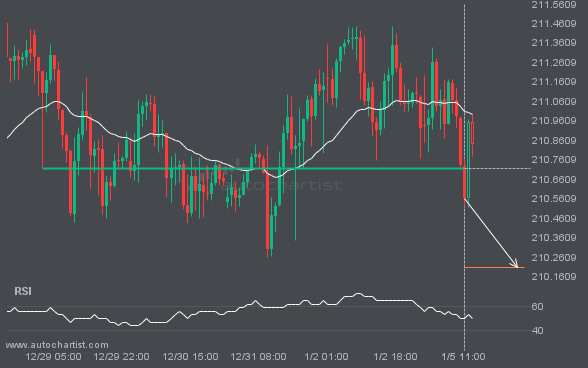
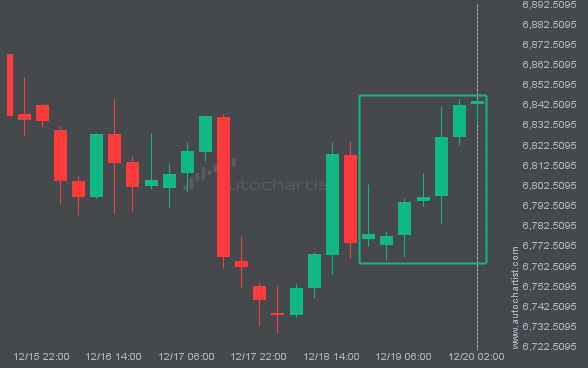
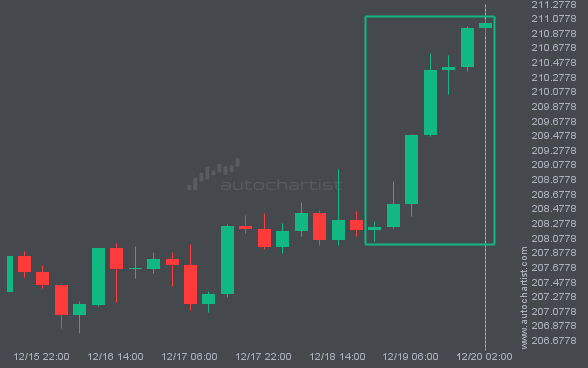
The price of GBPJPY is heading toward 210.2092. Despite the recent breakout through 210.7190, it may struggle to gain momentum to reach the forecast price and could move back in the other direction. This has happened many times in the past, so watch for a possible bounce back.
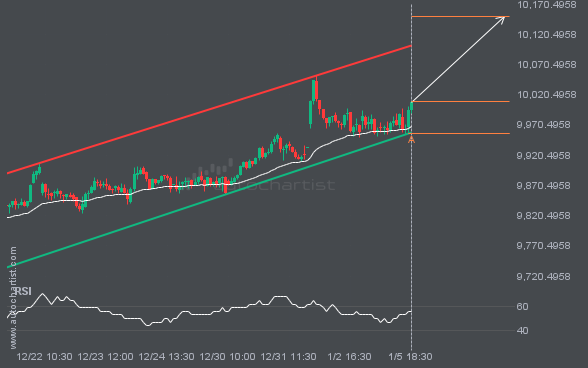
XAUUSD is moving toward a resistance line. Since it has retraced from this line before, we may see either a breakout through it or a rebound to current levels. It has touched this line multiple times in the past 10 days and may test it again within the next 2 days.
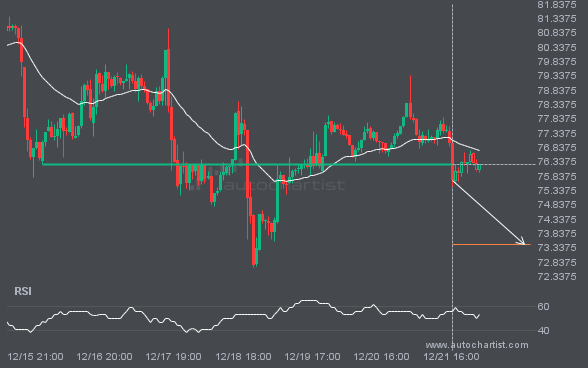
LTCUSD has broken through a line at 76.2300. If this breakout holds, we could see the price of LTCUSD move toward 73.4370 within the next 2 days. However, don’t be too quick to trade. It has tested this line many times in the past, so confirm the breakout before placing any trades.