 Skip to content
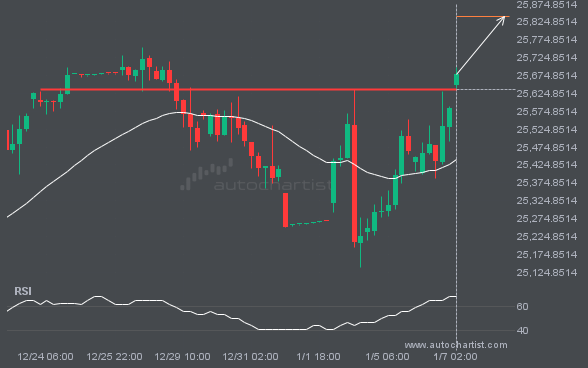
 NAS100 has broken through a resistance line. Because it has previously retraced from this price, you should wait for confirmation of the breakout before trading. It has touched this line multiple times over the past 15 days, which suggests a possible target around 25839.7754 within the next 3 days.
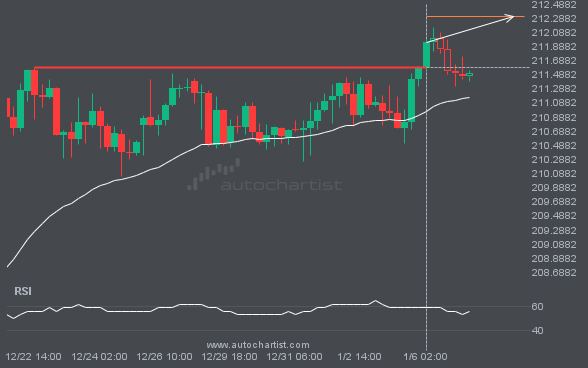
GBPJPY is once again retesting a key horizontal resistance level at 211.5930. This level has been tested 5 times recently and could see another bounce, as it did last time. However, after so many attempts, it may be ready to start a new trend.
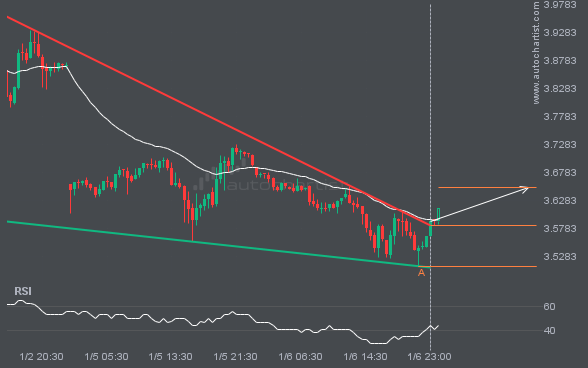
Falling Wedge pattern identified on NGC/USD has broken through a resistance level, with price momentum continuing to move upward. This presents a solid trading opportunity, with the price expected to reach 3.6524 in the next 15.
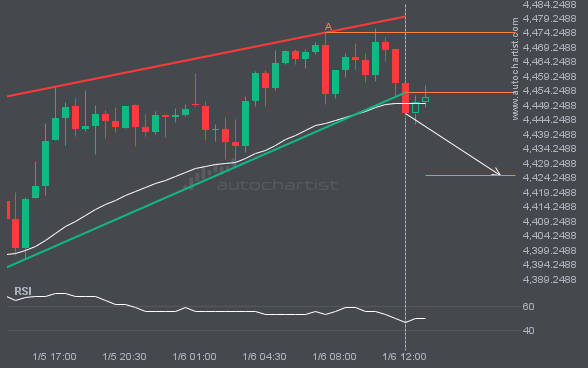
It would be prudent to confirm the breakout that just occurred. Do you consider the move through support significant? Do you have indicators confirming that the price momentum will continue? If so, aim for a target of 4424.8915, but consider reducing your position size as the price approaches that target.
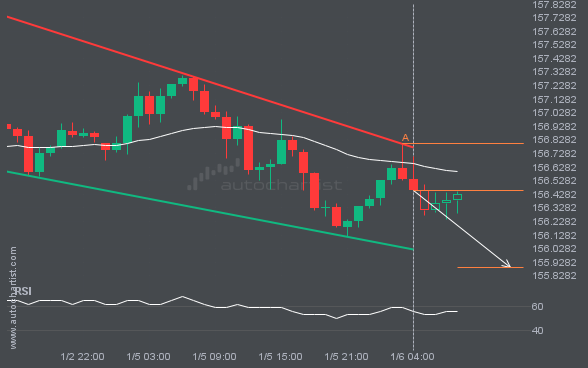
USDJPY is moving toward a support line. Since it has retraced from this line before, we may see either a breakout through it or a rebound to current levels. It has touched this line multiple times in the past 4 days and may test it again within the next 6 hours.
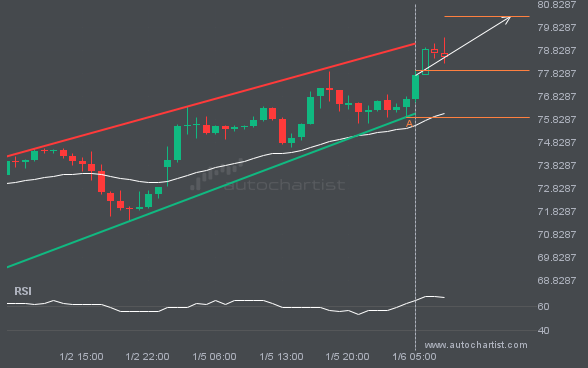
XAGUSD is moving toward a resistance line it has tested many times. It has retraced from this line before, so it’s unclear whether it will break through or rebound again. If XAGUSD continues on its current trajectory, it could reach 80.2846 within the next 9 hours.
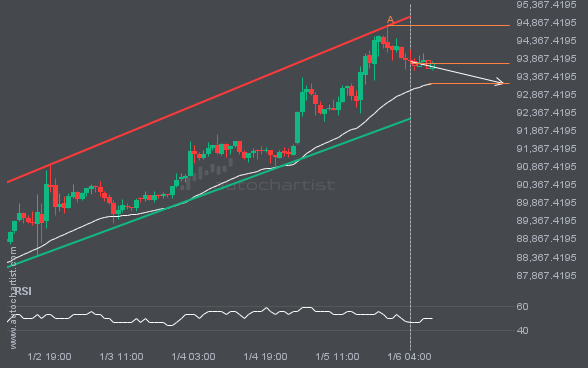
BTCUSD is heading toward the support line in a Channel Up pattern. If this move continues, the price of BTCUSD could test 93159.8538 within the next 22 hours. It has tested this line many times before, so the move could be short-lived and may rebound as it has before.

