Skip to content
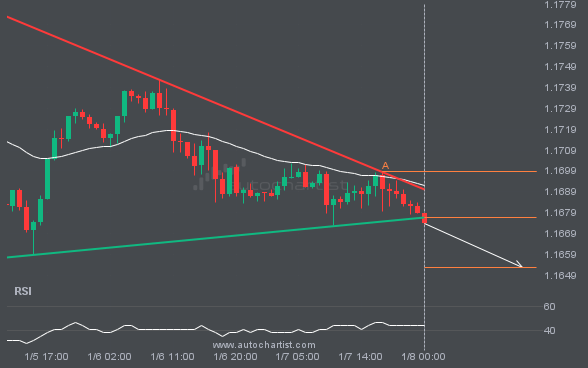
USDJPY was identified around 156.749 after recently rebounding off the support on the 4 hour interval. Ultimately, the stock’s price action has formed a Channel Up pattern. This squeeze may increase the chances of a strong breakout. The projected move could take the price to around 157.6524.
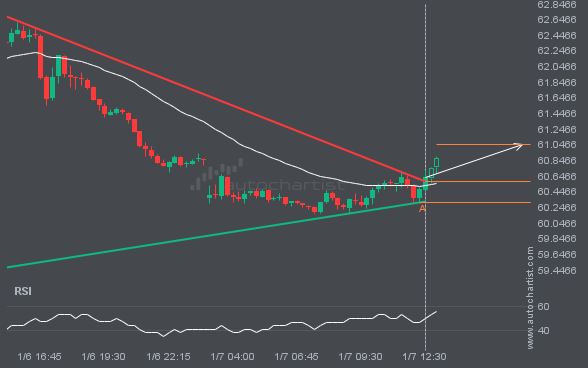
BRN/USD has moved through the resistance line of a Triangle pattern at 60.57892063492063 on the 15 Minutes chart. This line has been tested multiple times in the past, and this breakout could signal an upcoming change in the current trend. Price may continue in the current direction toward 61.0576.

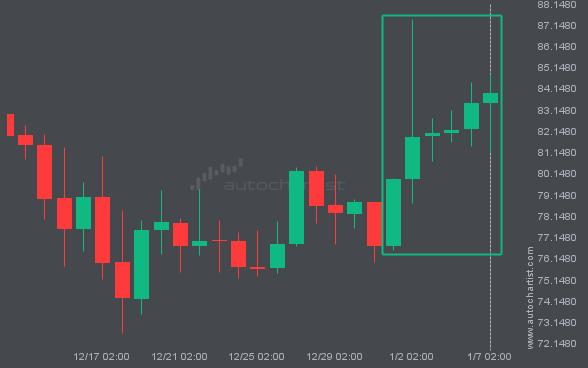
FTSE100 was identified around 10062.6 after recently rebounding off the resistance on the 1 hour interval. Ultimately, the stock’s price action has formed a Channel Up pattern. This squeeze may increase the chances of a strong breakout. The projected move could take the price to around 10044.0944.
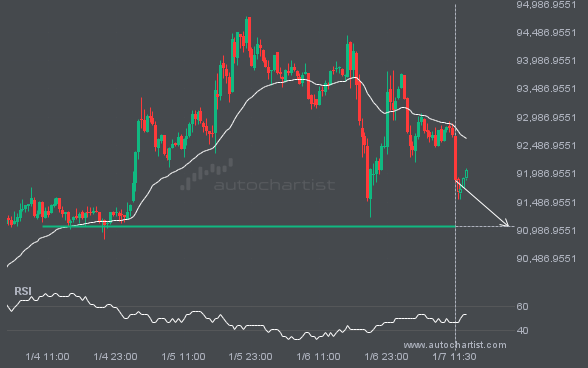
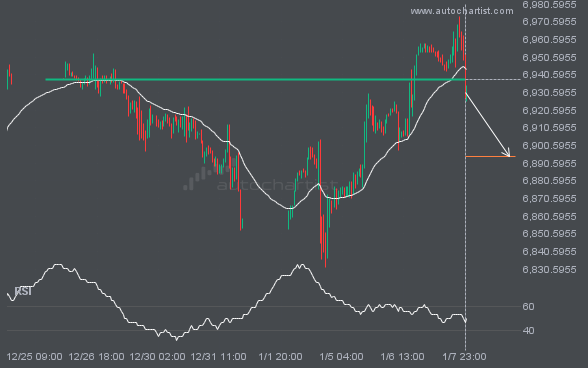
BTCUSD is moving toward a support line. Because it has retraced from this level in the past, we may see either a breakout through this line or a rebound to current levels. It has touched this line multiple times over the last 4 days and may test it again within the next 16 hours.