Skip to content
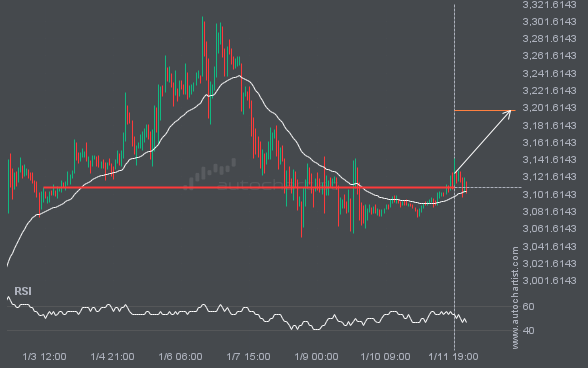
NAS100 is moving toward a level at 25705.0566, which it has tested many times before. We have seen it retrace from this level before, so at this stage it isn’t clear whether it will break through this price or rebound again. If NAS100 continues on its current trajectory, we may see it move toward 25705.0566 […]
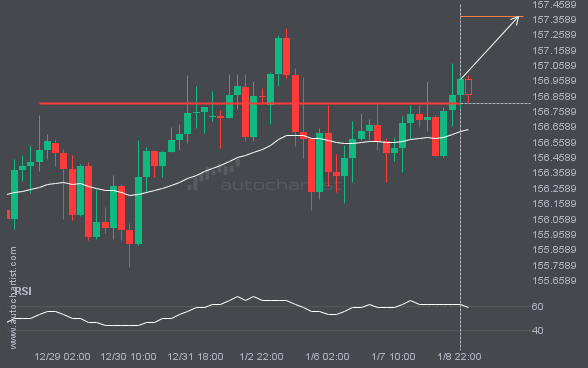
XAGUSD is moving toward a resistance line. Since it has retraced from this line before, we may see either a breakout through it or a rebound to current levels. It has touched this line multiple times in the past 28 days and may test it again within the next 3 days.
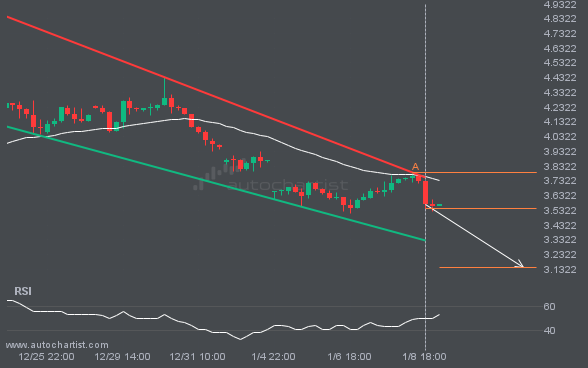
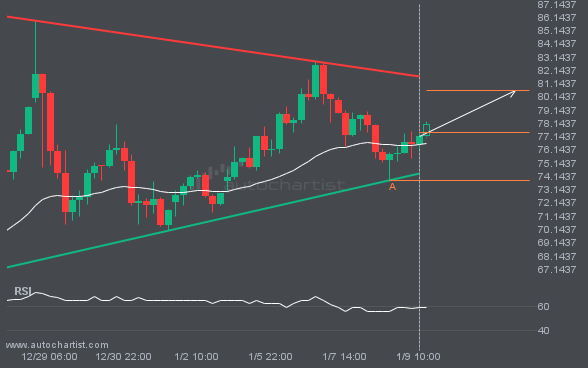
The movement of NGC/USD toward the support line of a Channel Down is yet another test of the line it has reached numerous times in the past. This test of the line could occur within the next 3 days, but it is uncertain whether it will result in a breakout through this line or simply […]
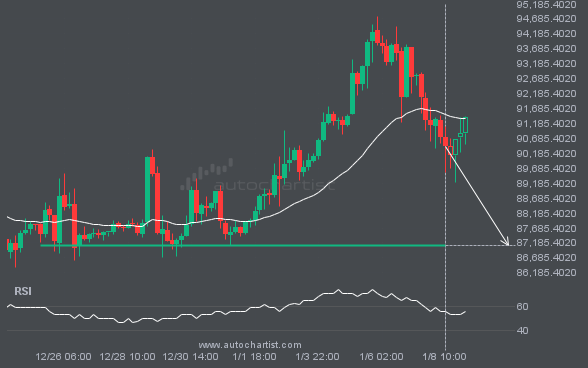
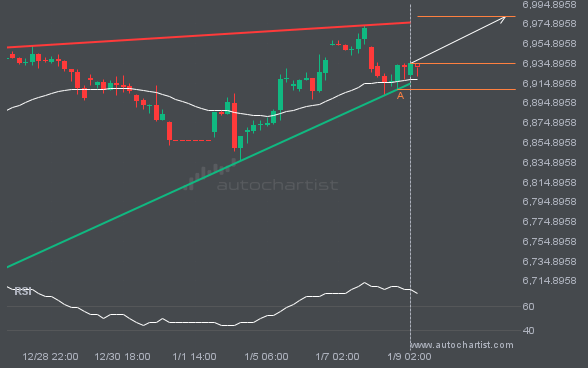
BTCUSD is moving toward a level at 87109.4531, which it has tested many times before. We have seen it retrace from this level before, so at this stage it isn’t clear whether it will break through this price or rebound again. If BTCUSD continues on its current trajectory, we may see it move toward 87109.4531 […]