Skip to content
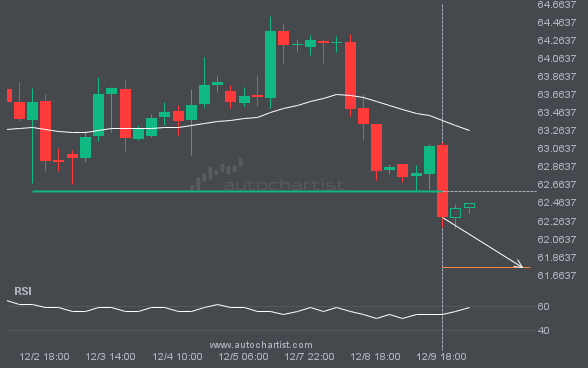
The breakout of BRN/USD through the 62.5920 price line is a breach of an important psychological price level that it has tested numerous times in the past. If this breakout persists, BRN/USD could test 61.7509 within the next 21 hours. One should always be cautious before placing a trade and wait for confirmation of the […]
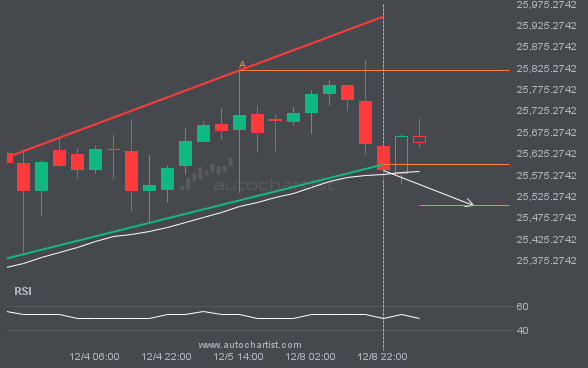
Channel Up pattern identified on NAS100 has broken through a support level, with price momentum continuing to move downward. This presents a solid trading opportunity, with the price expected to reach 25502.9658 in the next 12.
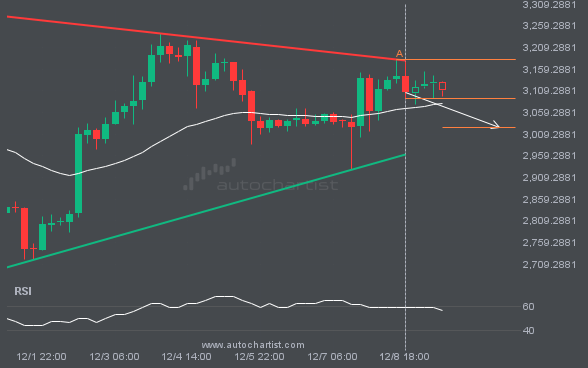
ETHUSD is trapped in a Triangle formation, implying that a breakout is imminent. This is a strong trade setup for both trend and swing traders. It is now approaching a resistance line that has been tested before. Divergence watchers may be optimistic about a potential breakout, which could mark the start of a new trend. […]
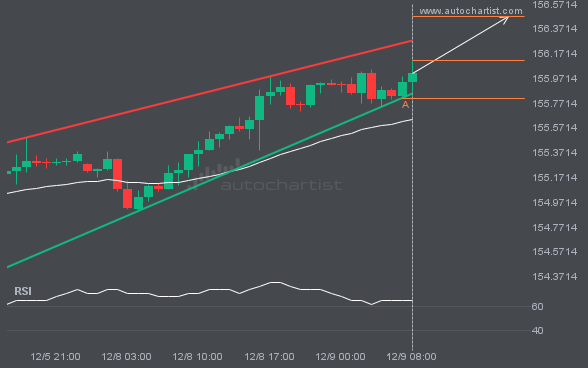
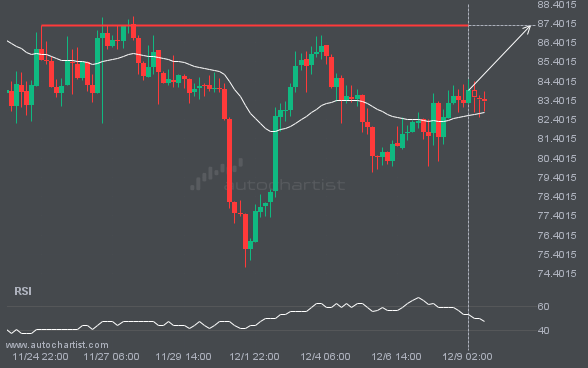
An emerging Rising Wedge has been detected on USDJPY. The pattern has not yet broken through support, but the price is expected to move up over the next few hours. At the time the pattern was found, the price was 156.1155, and it is expected to move to 156.4702.
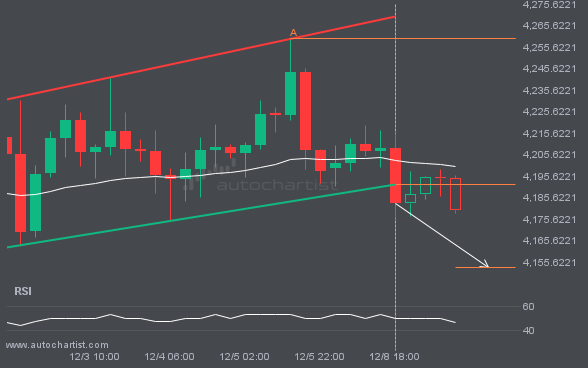
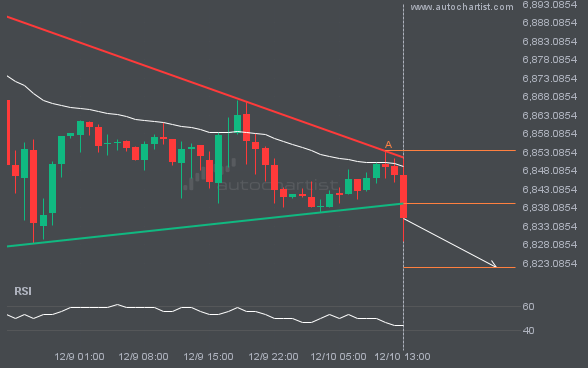
The last 8 4 hour candles on XAUUSD have formed a Flag pattern and broken out through the pattern lines, indicating a possible bearish movement toward the price level at 4153.1840.