...

Daily Top Trade Setups: Advanced Forex, Indices, Commodities, and Stock Analysis

BTCUSD is likely to test 88977.3906 in the near future. Where to next?

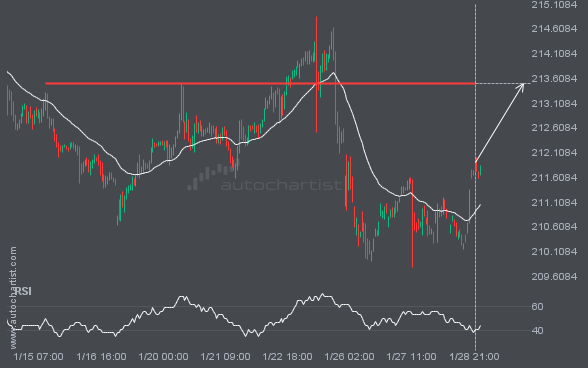
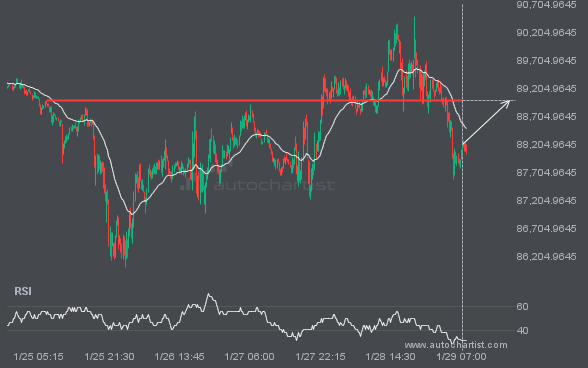
BTCUSD is moving toward a level at 88977.3906, which it has tested many times before. We have seen it retrace from this level before, so at this stage it isn’t clear whether it will break through this price or rebound again. If BTCUSD continues on its current trajectory, we may see it move toward 88977.3906 […]

XAUUSD recorded 8 consecutive daily bullish candles.

A rare candlestick sequence was recorded on the XAUUSD Daily chart, ending at 5517.2905.

Will GBPJPY break through the resistance level it previously tested?

GBPJPY is moving toward a key resistance level at 213.5020. This level has been tested before for GBPJPY. This may present a good trading opportunity either at the spot price or after a breakout through this level.

NGC/USD is quickly approaching an important level it has tested many times before.

NGC/USD is approaching a support line at 4.6215. If it hits the support line, it may break through this level to continue the bearish trend, or it may return to current levels.

FTSE100 is likely to test 10116.5996 in the near future. Where to next?

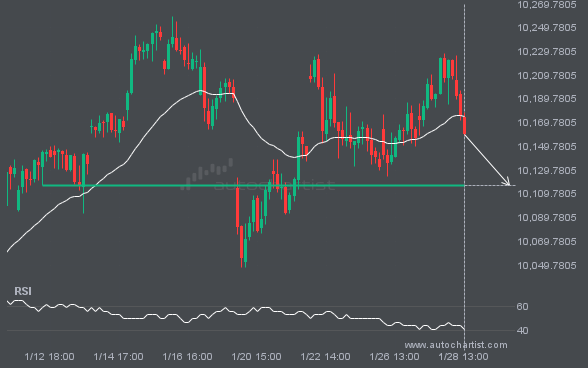
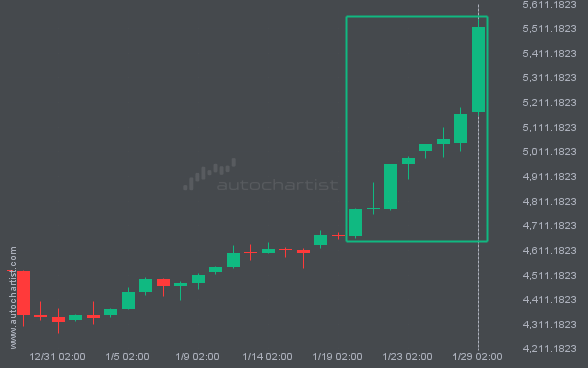
FTSE100 is approaching the line at 10116.5996. If this move continues, the price of FTSE100 could test 10116.5996 within the next 2 days. But do not rush to trade. It has tested this line many times in the past, so the move could be short-lived and end in a rebound.

LTCUSD is likely to test 70.1900 in the near future. Where to next?

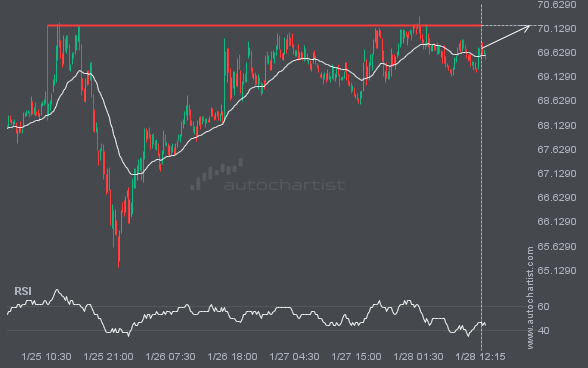
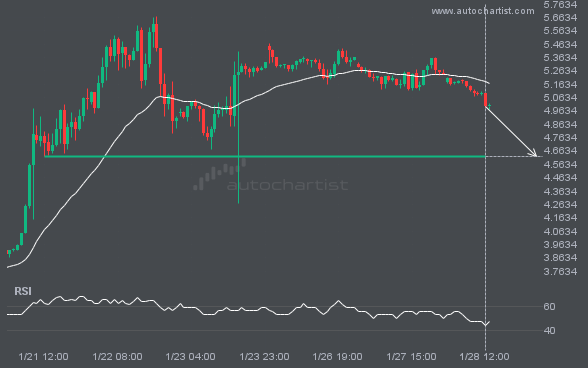
The movement of LTCUSD towards the 70.1900 price line is yet another test of a line it has reached numerous times in the past. We can expect this test to occur within the next 17 hours, but it is uncertain whether it will result in a breakout through this line or simply rebound to current […]

A Channel Up has formed, and NAS100 is approaching resistance. Should we expect a breakout and the start of a new trend, or a reversal?

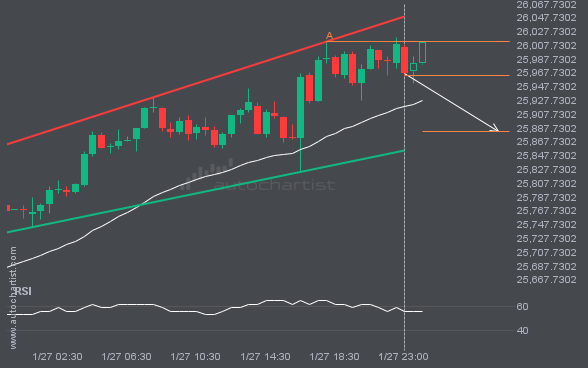
An emerging Channel Up pattern in its final wave has been identified on the NAS100 30 Minutes chart. After a strong bearish run, NAS100 is heading toward the upper triangle trendline, with possible resistance at 25882.5954. If the support holds, the Channel Up pattern suggests a rebound toward current levels.

Latest company news, corporate actions and partnership announcements

Interesting trading articles, ideas, and thought leadership

Ask your broker today or sign up for a demo
from the Technical Analysis page.