Skip to content
XAUUSD is moving towards a key support level at 2976.3701. XAUUSD has previously tested this level 4 times and on each occasion it has bounced back off this level. Is this finally the time it will break through?
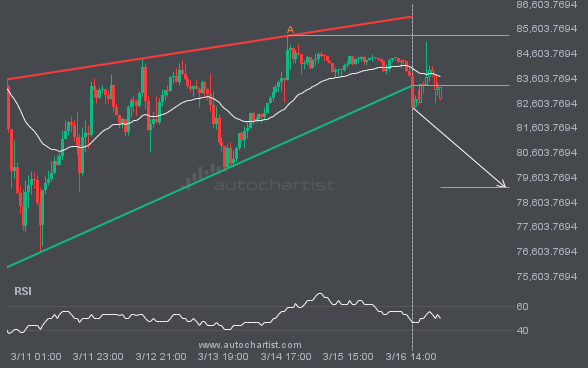
BTCUSD has broken through the support line of a Rising Wedge technical chart pattern. Because we have seen it retrace from this line in the past, one should wait for confirmation of the breakout before taking any action. It has touched this line twice in the last 9 days and suggests a possible target level […]
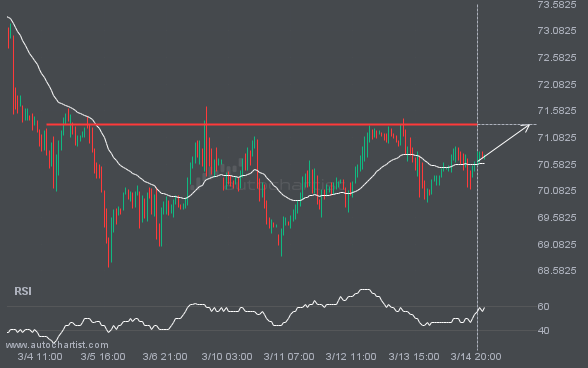
BRN/USD is moving towards a resistance line. Because we have seen it retrace from this level in the past, we could see either a break through this line, or a rebound back to current levels. It has touched this line numerous times in the last 11 days and may test it again within the next […]
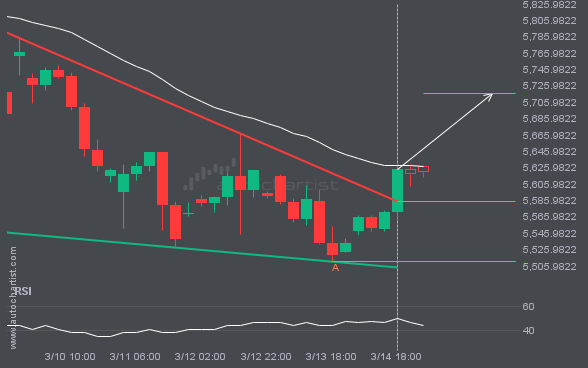
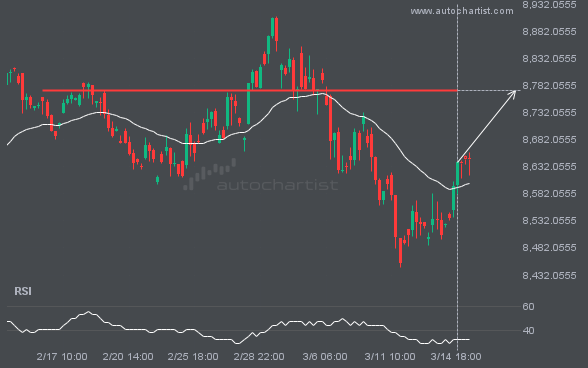
S&P500 has broken through the resistance line of a Falling Wedge technical chart pattern. Because we have seen it retrace from this line in the past, one should wait for confirmation of the breakout before taking any action. It has touched this line twice in the last 11 days and suggests a possible target level […]
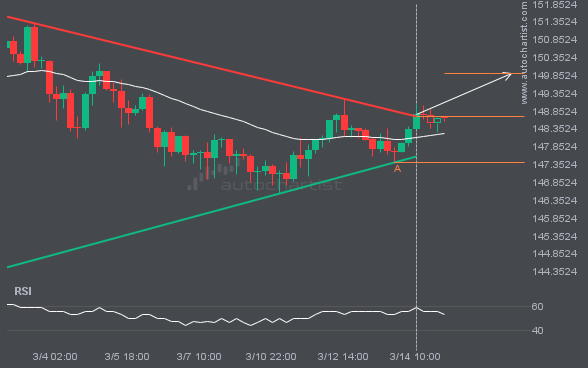
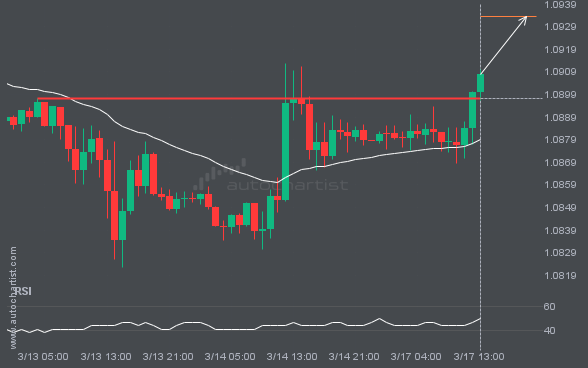
USDJPY moved through the resistance line of a Triangle at 148.70676744186045 on the 4 hour chart. This line has been tested a number of times in the past and this breakout could mean an upcoming change from the current trend. It may continue in its current direction toward 149.8931.