Skip to content
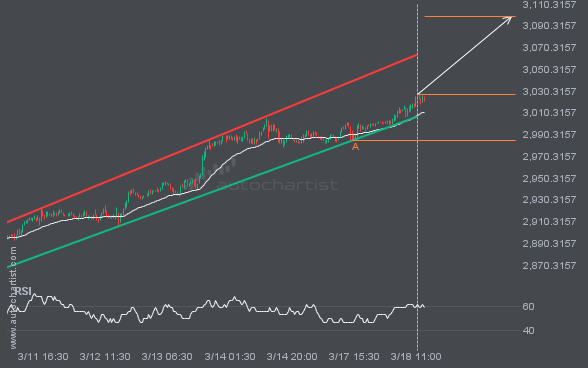
 Emerging Channel Up detected on XAUUSD – the pattern is an emerging one and has not yet broken through support, but the price is expected to move up over the next few hours. The price at the time the pattern was found was 3027.35 and it is expected to move to 3098.7860.
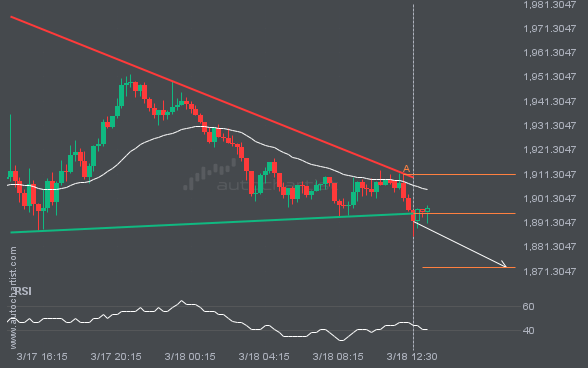
You would be well advised to confirm the breakout that has just occurred – do you believe the move through support to be significant? Do you have confirming indicators that the price momentum will continue? If so, look for a target of 1872.8254 but consider reducing the size of your position as the price gets […]
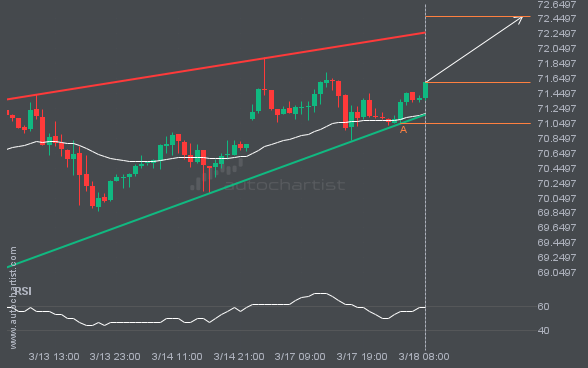
An emerging Channel Up has been detected on GBPJPY on the 4 hour chart. There is a possible move towards 196.0009 next few candles. Once reaching support it may continue its bullish run or reverse back to current price levels.
The movement of NAS100 towards 19515.0234 price line is yet another test of the line it reached numerous times in the past. We could expect this test to happen in the next 17 hours, but it is uncertain whether it will result in a breakout through this line, or simply rebound back to current lines.
LTCUSD is heading towards a line of 86.0700. If this movement continues, the price of LTCUSD could test 86.0700 within the next 2 days. But don’t be so quick to trade, it has tested this line numerous times in the past, so this movement could be short-lived and end up rebounding.
Emerging Falling Wedge pattern in its final wave was identified on the NGC/USD 4 hour chart. After a strong bearish run, we find NGC/USD heading towards the upper triangle line with a possible resistance at 3.8037. If the support shows to hold, the Falling Wedge pattern suggests a rebound back towards current levels.