Daily Top Trade Setups: Advanced Forex, Indices, Commodities, and Stock Analysis
S&P500 reached 6801.49 after a move of 3.53% spanning 18 hours.
S&P500 just posted a 3.53% move over the past 18 hours—a move unlikely to go unnoticed by any trading style.
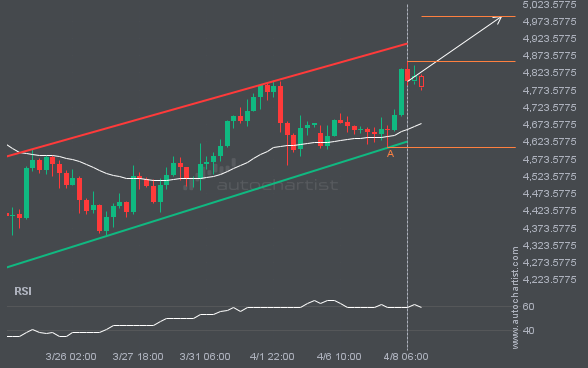
XAUUSD is approaching a resistance line of a Channel Up. It has touched this line numerous times in the last 17 days.
XAUUSD is trapped in a Channel Up formation, implying that a breakout is imminent. This is a strong trade setup for both trend and swing traders. It is now approaching a support line that has been tested before. Divergence watchers may be optimistic about a potential breakout, which could mark the start of a new […]
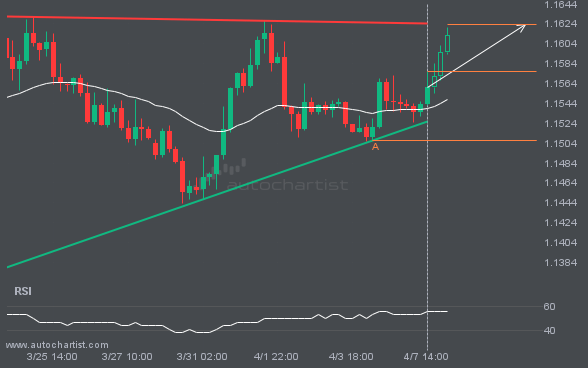
EURUSD is approaching a resistance line of a Ascending Triangle. It has touched this line numerous times in the last 25 days.
The movement of EURUSD toward the resistance line of a Ascending Triangle is yet another test of the line it has reached numerous times in the past. This test of the line could occur within the next 3 days, but it is uncertain whether it will result in a breakout through this line or simply […]
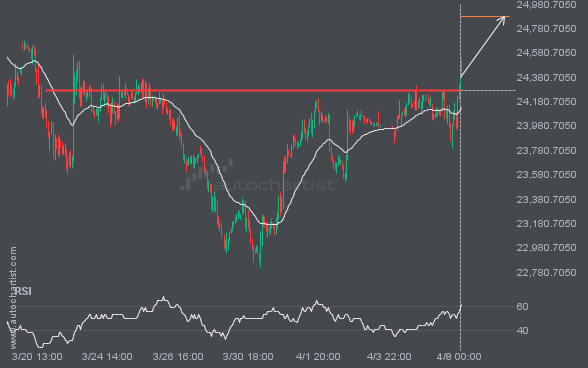
NAS100 has broken through a level it has tested 5 times recently.
The breakout of NAS100 through the 24267.3945 price line is a breach of an important psychological price level that it has tested numerous times in the past. If this breakout persists, NAS100 could test 24877.7734 within the next 4 days. One should always be cautious before placing a trade and wait for confirmation of the […]
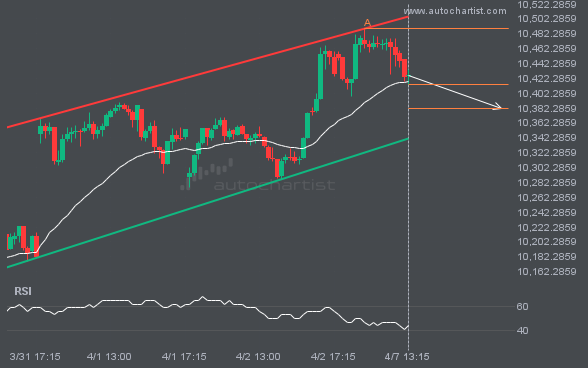
FTSE100 is approaching a support line that has been tested at least twice before
A Channel Up pattern was identified for FTSE100 at 10414.37, suggesting it may move toward the support line at 10381.1036. It may break through that line and continue the bearish trend, or reverse from it.
A final push is possible for XAGUSD as it approaches 71.5396.
XAGUSD is moving toward a key support level at 71.5396. XAGUSD has tested this level 5 times before, and on each occasion it has bounced off. Could this be the time it finally breaks through?
Resistance line has been breached by ETHUSD. This price level has been tested at least twice before.
ETHUSD has moved through the resistance line of a Triangle pattern at 2147.7260465116274 on the 4 hour chart. This line has been tested multiple times in the past, and this breakout could signal an upcoming change in the current trend. Price may continue in the current direction toward 2204.4420.
Latest company news, corporate actions and partnership announcements
Interesting trading articles, ideas, and thought leadership
Ask your broker today or sign up for a demo from the Technical Analysis page.