Daily Top Trade Setups: Advanced Forex, Indices, Commodities, and Stock Analysis
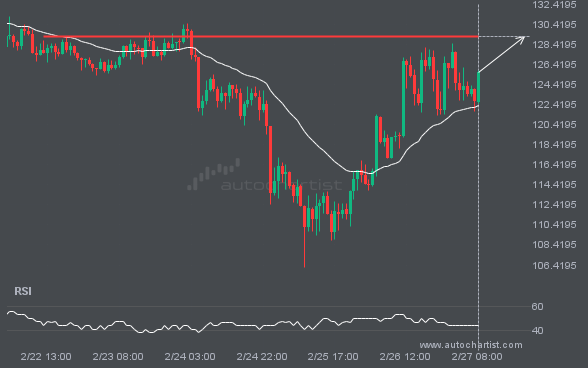
If you’re short LTCUSD you should be aware of the rapidly approaching level of 129.1800
LTCUSD is heading towards 129.1800 and could reach this point within the next 2 days. It has tested this line numerous times in the past, and this time could be no different, ending in a rebound instead of a breakout. If the breakout doesn’t happen, we could see a retracement back down to current levels.
Because XAGUSD formed a Channel Down pattern, we expect it to touch the resistance line. If it breaks through resistance it may move much higher
XAGUSD is moving towards a resistance line which it has tested numerous times in the past. We have seen it retrace from this line before, so at this stage it isn’t clear whether it will breach this line or rebound as it did before. If XAGUSD continues in its current trajectory, we could see it […]
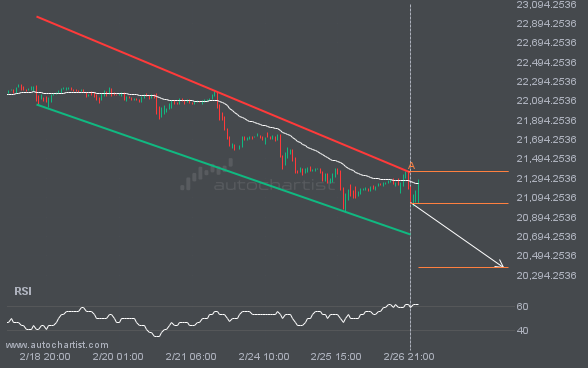
A Channel Down has formed, NAS100 is approaching resistance. Can we expect a breakout and the start of a new trend or a reversal?
Emerging Channel Down detected on NAS100 – the pattern is an emerging one and has not yet broken through resistance, but the price is expected to move up over the next few hours. The price at the time the pattern was found was 21035.8496 and it is expected to move to 20374.2360.
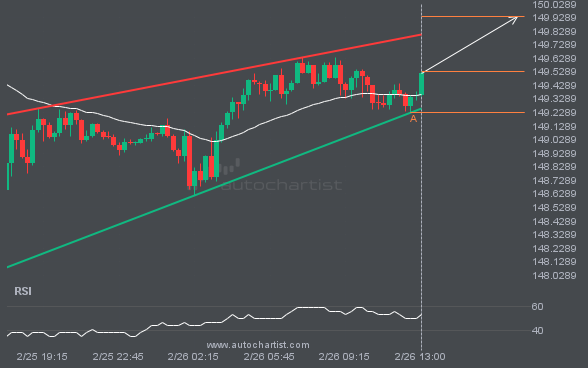
USDJPY – approaching a resistance line that has been previously tested at least twice in the past
An emerging Rising Wedge has been detected on USDJPY on the 15 Minutes chart. There is a possible move towards 149.9364 next few candles. Once reaching support it may continue its bullish run or reverse back to current price levels.
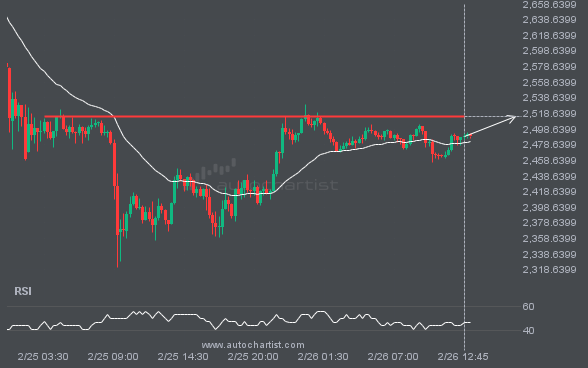
ETHUSD is quickly approaching a very important level it has previously tested numerous times in the past
The movement of ETHUSD towards 2514.8000 price line is yet another test of the line it reached numerous times in the past. We could expect this test to happen in the next 7 hours, but it is uncertain whether it will result in a breakout through this line, or simply rebound back to current lines.
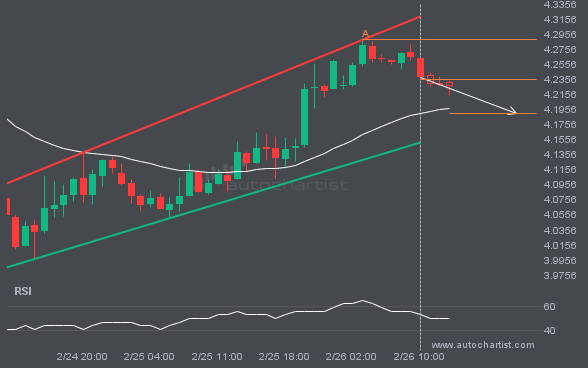
Because NGC/USD formed a Channel Up pattern, we expect it to touch the support line. If it breaks through support it may move much lower
Emerging Channel Up pattern in its final wave was identified on the NGC/USD 1 hour chart. After a strong bearish run, we find NGC/USD heading towards the upper triangle line with a possible resistance at 4.1904. If the support shows to hold, the Channel Up pattern suggests a rebound back towards current levels.
A final push possible on FTSE100 as it starts approaching a price line of 8772.7002.
FTSE100 is approaching a resistance line at 8772.7002. If it hits the resistance line, it may break through this level to continue the bullish trend, or it may turn around back to current levels.
Latest company news, corporate actions and partnership announcements
Interesting trading articles, ideas, and thought leadership
Ask your broker today or sign up for a demo from the Technical Analysis page.