Daily Top Trade Setups: Advanced Forex, Indices, Commodities, and Stock Analysis
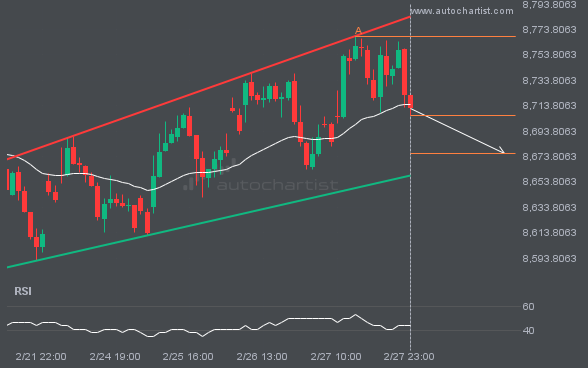
Because FTSE100 formed a Channel Up pattern, we expect it to touch the support line. If it breaks through support it may move much lower
FTSE100 is approaching the support line of a Channel Up. It has touched this line numerous times in the last 9 days. If it tests this line again, it should do so in the next 19 hours.
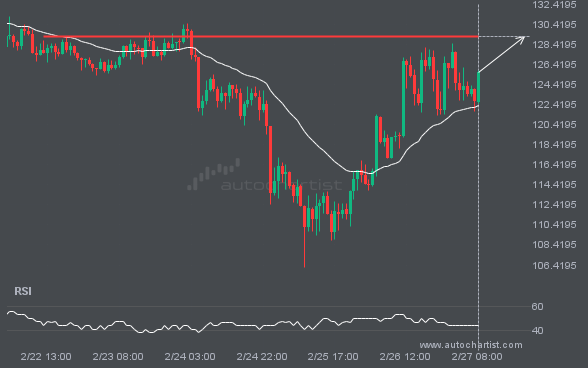
USDJPY – breach of price line that’s been previously tested numerous times before
USDJPY has broken through a resistance line. Because we have seen it retrace from this price in the past, one should wait for confirmation of the breakout before trading. It has touched this line numerous times in the last 7 days and suggests a possible target level to be around 150.7258 within the next 2 […]
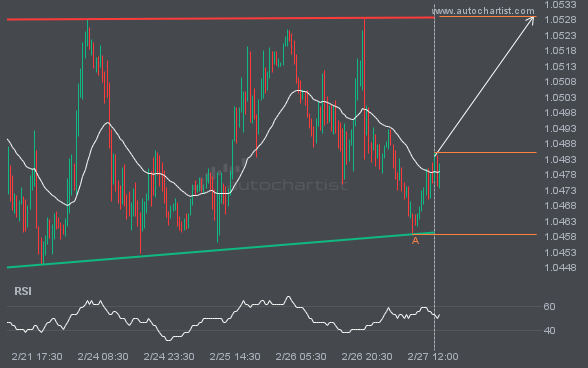
EURUSD is signaling a possible trend reversal on the intraday charts with price not breaching support.
EURUSD is trapped in a Ascending Triangle formation, implying that a breakout is Imminent. This is a great trade-setup for both trend and swing traders. It is now approaching a support line that has been tested in the past. Divergence opportunists may be very optimistic about a possible breakout and this may be the start […]
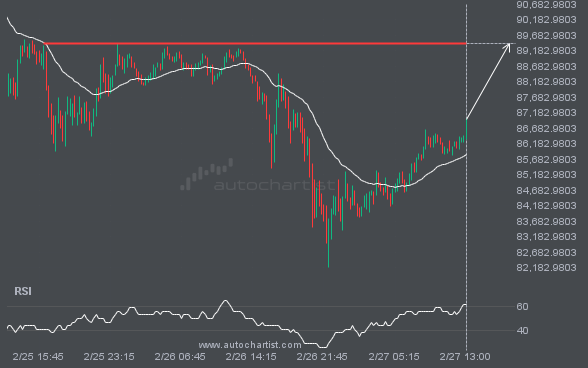
Will BTCUSD break through the resistance level it tested before?
The price of BTCUSD in heading back to the resistance area. It is possible that it will struggle to break through it and move back in the other direction. The price may eventually break through, but typically the price retreats from the level a number of times before doing so.
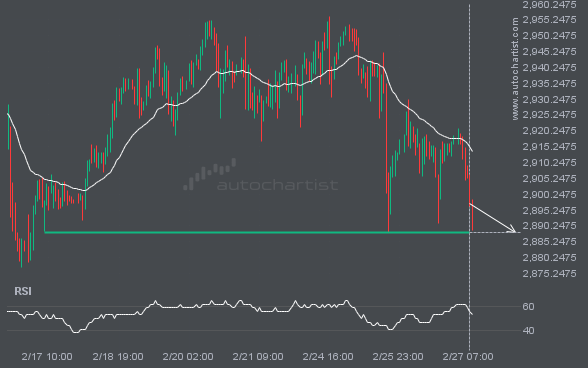
After testing 2888.2900 numerous times, XAUUSD is once again approaching this price point. Can we expect a bearish trend to follow?
XAUUSD is heading towards 2888.2900 and could reach this point within the next 2 days. It has tested this line numerous times in the past, and this time could be no different, ending in a rebound instead of a breakout. If the breakout doesn’t happen, we could see a retracement back down to current levels.
If you’re short LTCUSD you should be aware of the rapidly approaching level of 129.1800
LTCUSD is heading towards 129.1800 and could reach this point within the next 2 days. It has tested this line numerous times in the past, and this time could be no different, ending in a rebound instead of a breakout. If the breakout doesn’t happen, we could see a retracement back down to current levels.
Because XAGUSD formed a Channel Down pattern, we expect it to touch the resistance line. If it breaks through resistance it may move much higher
XAGUSD is moving towards a resistance line which it has tested numerous times in the past. We have seen it retrace from this line before, so at this stage it isn’t clear whether it will breach this line or rebound as it did before. If XAGUSD continues in its current trajectory, we could see it […]
Latest company news, corporate actions and partnership announcements
Interesting trading articles, ideas, and thought leadership
Ask your broker today or sign up for a demo from the Technical Analysis page.