Daily Top Trade Setups: Advanced Forex, Indices, Commodities, and Stock Analysis
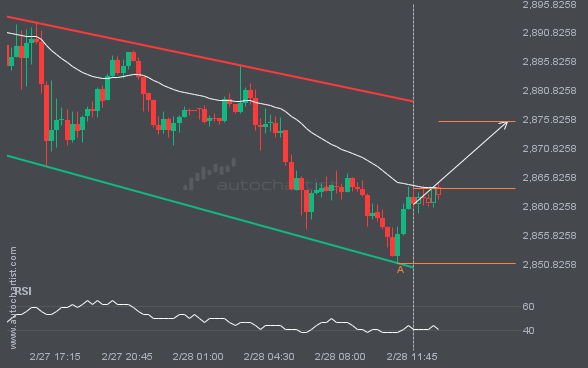
XAUUSD is approaching a resistance line of a Channel Down. It has touched this line numerous times in the last 2 days.
XAUUSD is heading towards the resistance line of a Channel Down. If this movement continues, the price of XAUUSD could test 2875.5631 within the next 5 hours. It has tested this line numerous times in the past, so this movement could be short-lived and end up rebounding just like it did in the past.
LTCUSD seems to be on its way to resistance – a possible opportunity?
A strong resistance level has been identified at 130.9400 on the 30 Minutes LTCUSD chart. LTCUSD is likely to test it soon.
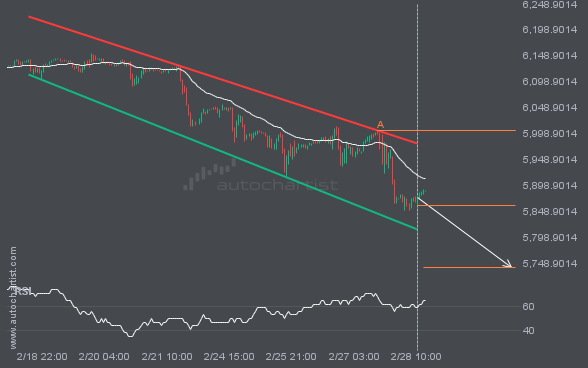
After testing the support line numerous times, S&P500 is once again approaching this line. Can we expect a bearish trend to follow?
S&P500 is approaching the support line of a Channel Down. It has touched this line numerous times in the last 10 days. If it tests this line again, it should do so in the next 3 days.
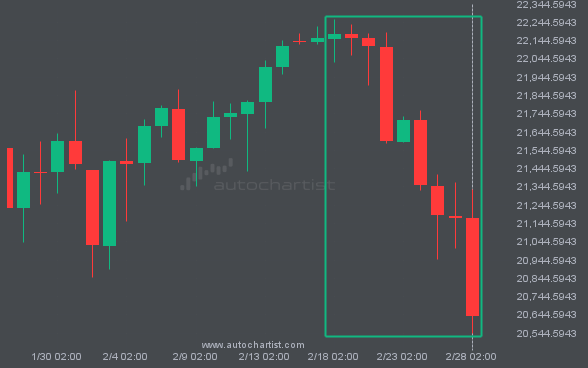
Could a large bearish move on NAS100 be a sign of things to come?
NAS100 dropped sharply for 10 days – which is an excessively big movement for this instrument; exceeding the 98% of past price moves. Even if this move is a sign of a new trend in NAS100 there is a chance that we will witness a correction, no matter how brief.
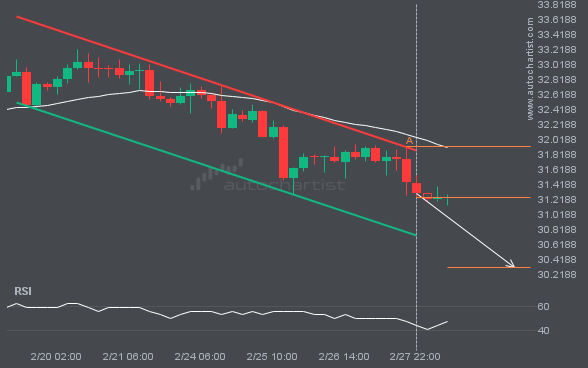
XAGUSD is signaling a possible trend reversal on the intraday charts with price not breaching resistance.
XAGUSD is heading towards the support line of a Channel Down and could reach this point within the next 2 days. It has tested this line numerous times in the past, and this time could be no different from the past, ending in a rebound instead of a breakout. If the breakout doesn’t happen, we […]
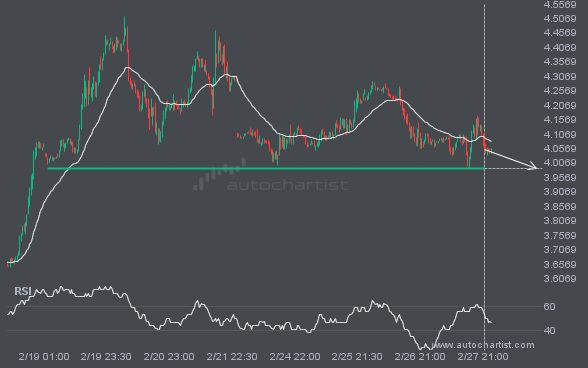
Will NGC/USD break through the support level it tested before?
NGC/USD is en route to a very important line that will be a definite deciding factor of what is to come! We may see this trajectory continue to touch and break through 3.9865, unless it runs out of momentum and pulls back to current levels.
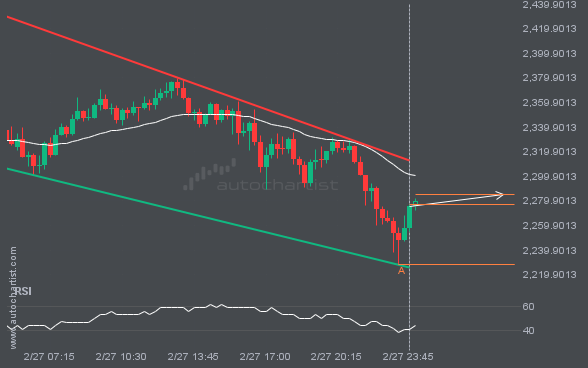
A possible move on ETHUSD as it heads towards resistance
Emerging Channel Down pattern in its final wave was identified on the ETHUSD 15 Minutes chart. After a strong bullish run, we find ETHUSD heading towards the upper triangle line with a possible resistance at 2285.0740. If the resistance shows to hold, the Channel Down pattern suggests a rebound back towards current levels.
Latest company news, corporate actions and partnership announcements
Interesting trading articles, ideas, and thought leadership
Ask your broker today or sign up for a demo from the Technical Analysis page.