Daily Top Trade Setups: Advanced Forex, Indices, Commodities, and Stock Analysis
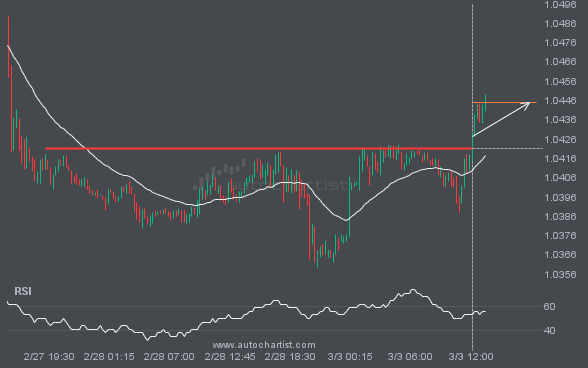
EURUSD has broken through a level it has tested 3 times in the recent past.
EURUSD is once again retesting a key horizontal resistance level at 1.0421. It has tested this level 3 times in the recent past and could simply bounce off like it did last time. However, after this many tries, maybe it’s ready to start a new trend.
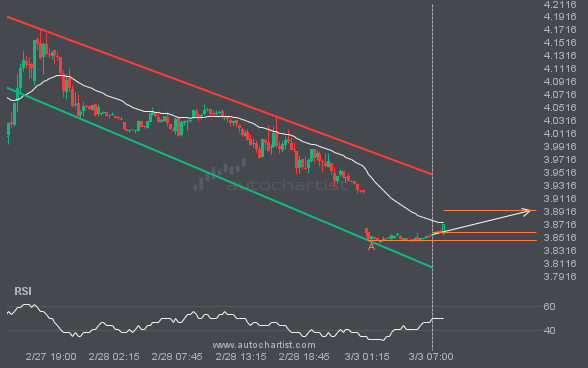
Because NGC/USD formed a Channel Down pattern, we expect it to touch the resistance line. If it breaks through resistance it may move much higher
NGC/USD is heading towards the resistance line of a Channel Down and could reach this point within the next 10 hours. It has tested this line numerous times in the past, and this time could be no different from the past, ending in a rebound instead of a breakout. If the breakout doesn’t happen, we […]
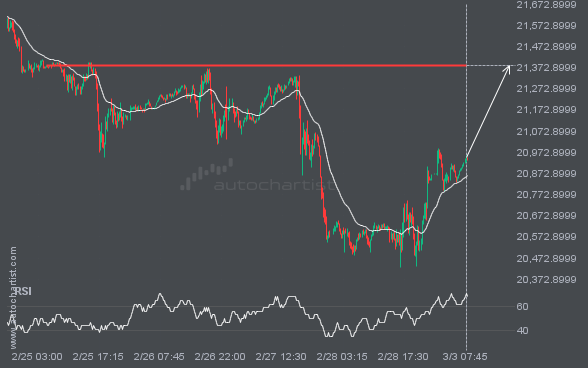
NAS100 is quickly approaching a very important level it has previously tested numerous times in the past
NAS100 is heading towards 21383.7539 and could reach this point within the next 2 days. It has tested this line numerous times in the past, and this time could be no different, ending in a rebound instead of a breakout. If the breakout doesn’t happen, we could see a retracement back down to current levels.
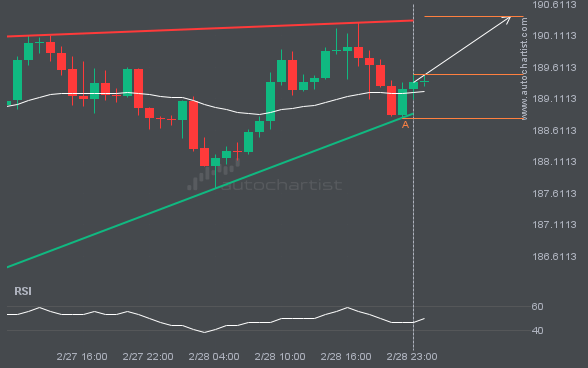
Important resistance line being approached by GBPJPY. This price has been tested numerous time in the last 2 days
Emerging Rising Wedge detected on GBPJPY – the pattern is an emerging one and has not yet broken through support, but the price is expected to move up over the next few hours. The price at the time the pattern was found was 189.49 and it is expected to move to 190.4123.
Supports and resistances are primary concepts of technical analysis. BTCUSD is heading for an important price of 97046.2031 – read about what this could mean for the future.
BTCUSD is moving towards a key resistance level at 97046.2031. This is a previously tested level for BTCUSD. This could be a good trading opportunity, either at the spot price, or after breaching this level.
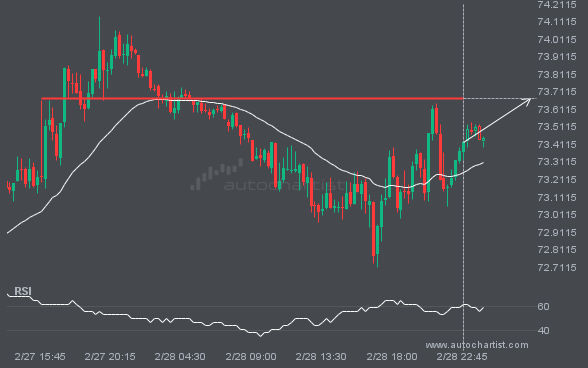
BRN/USD – approaching a price line that has been previously tested numerous times in the past
BRN/USD is en route to a very important line that will be a definite deciding factor of what is to come! We may see this trajectory continue to touch and break through 73.6755, unless it runs out of momentum and pulls back to current levels.
If you’re short FTSE100 you should be aware that 8791.4502 has just been breached – a level tested 3 time in the past
FTSE100 is once again retesting a key horizontal resistance level at 8791.4502. It has tested this level 3 times in the recent past and could simply bounce off like it did last time. However, after this many tries, maybe it’s ready to start a new trend.
Latest company news, corporate actions and partnership announcements
Interesting trading articles, ideas, and thought leadership
Ask your broker today or sign up for a demo from the Technical Analysis page.