Skip to content
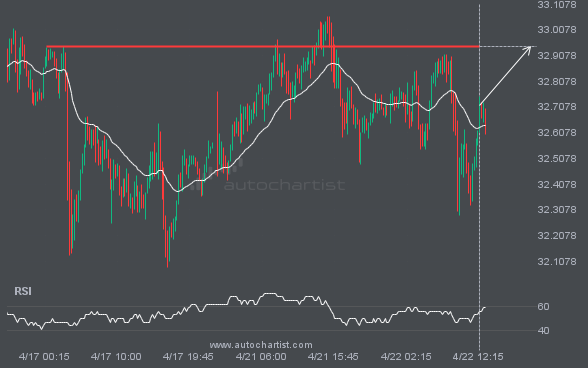
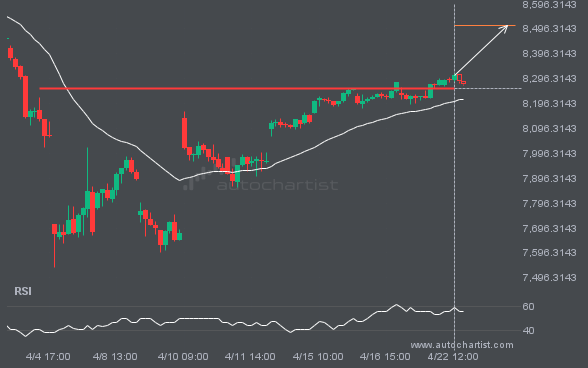
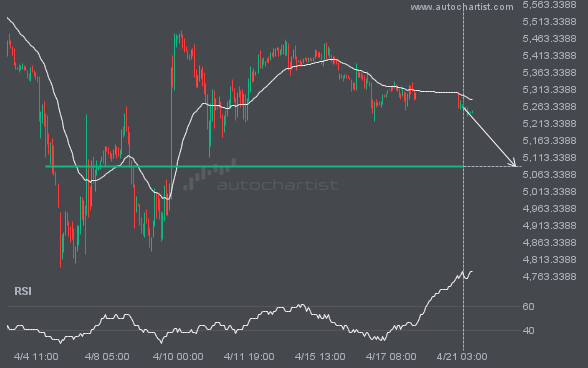
Emerging Rising Wedge detected on BTCUSD – the pattern is an emerging one and has not yet broken through support, but the price is expected to move up over the next few hours. The price at the time the pattern was found was 88854.09 and it is expected to move to 90128.4208.
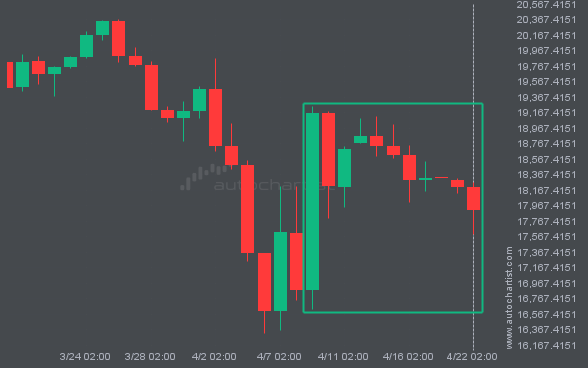
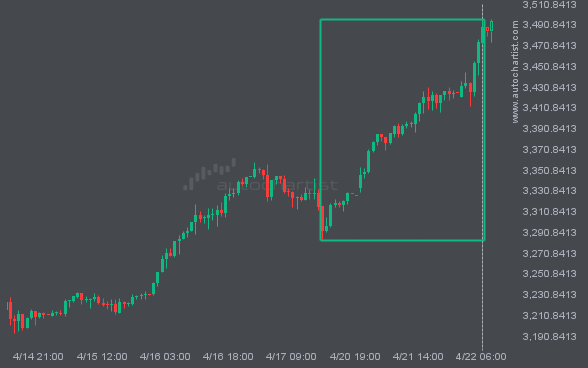
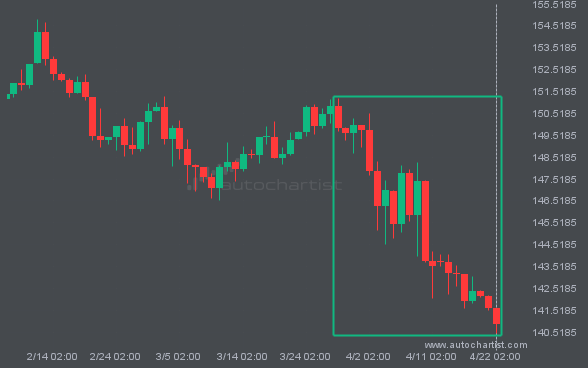
For those of you that don’t believe in trends, this may be an opportunity to take advantage of an exceptional 6.57% move on NAS100. The movement has happened over the last 14 days. For those trend followers among you, you may think about riding this possible trend.