Daily Top Trade Setups: Advanced Forex, Indices, Commodities, and Stock Analysis
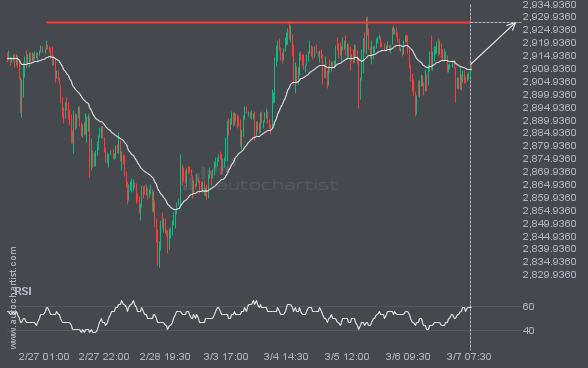
A final push possible on XAUUSD as it starts approaching a price line of 2927.9099.
XAUUSD is about to retest a key horizontal resistance level near 2927.9099. It has tested this level 5 times in the recent past and could simply bounce off like it did last time. However, after this many tries, maybe it’s ready to start a new trend.
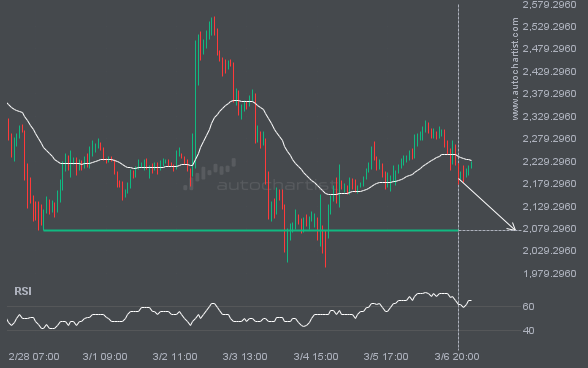
After testing 2074.2700 numerous times, ETHUSD is once again approaching this price point. Can we expect a bearish trend to follow?
ETHUSD is heading towards 2074.2700 and could reach this point within the next 2 days. It has tested this line numerous times in the past, and this time could be no different, ending in a rebound instead of a breakout. If the breakout doesn’t happen, we could see a retracement back down to current levels.
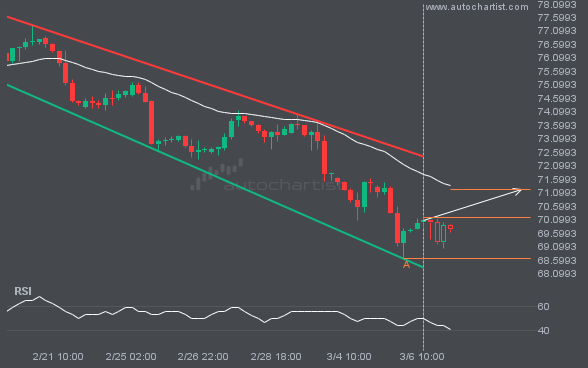
BRN/USD is quickly approaching the resistance line of a Channel Down. We expect either a breakout through this line or a rebound.
Emerging Channel Down detected on BRN/USD – the pattern is an emerging one and has not yet broken through support, but the price is expected to move up over the next few hours. The price at the time the pattern was found was 70.1825 and it is expected to move to 71.2242.
FTSE100 moves lower to 8623.7 in the last 2 days.
Those of you that are trend followers are probably eagerly watching FTSE100 to see if its latest 2.03% move continues. If not, the mean-reversion people out there will be delighted with this exceptionally large 2 days move.
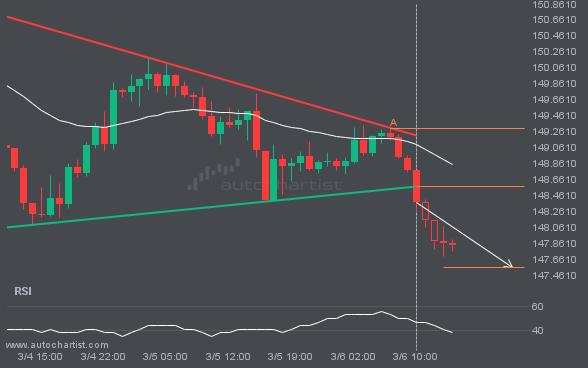
A possible move by USDJPY towards 147.5667
The last 3 1 hour candles on USDJPY formed a Triangle pattern and broken out through the pattern lines, indicating a possible bearish movement towards the price level of 147.5667.
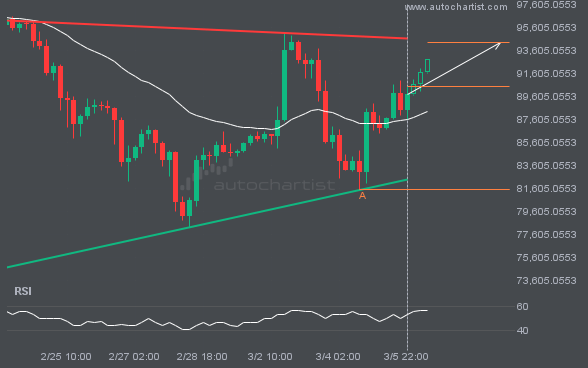
BTCUSD is signaling a possible trend reversal on the intraday charts with price not breaching support.
A Ascending Triangle pattern was identified on BTCUSD at 90465.84, creating an expectation that it may move to the resistance line at 94254.8397. It may break through that line and continue the bullish trend or it may reverse from that line.
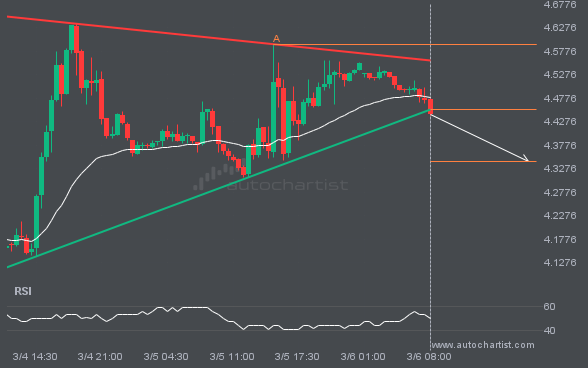
NGC/USD has broken through support of a Triangle. It has touched this line at least twice in the last 3 days.
The last 3 30 Minutes candles on NGC/USD formed a Triangle pattern and broken out through the pattern lines, indicating a possible bearish movement towards the price level of 4.3422.
Latest company news, corporate actions and partnership announcements
Interesting trading articles, ideas, and thought leadership
Ask your broker today or sign up for a demo from the Technical Analysis page.