Skip to content
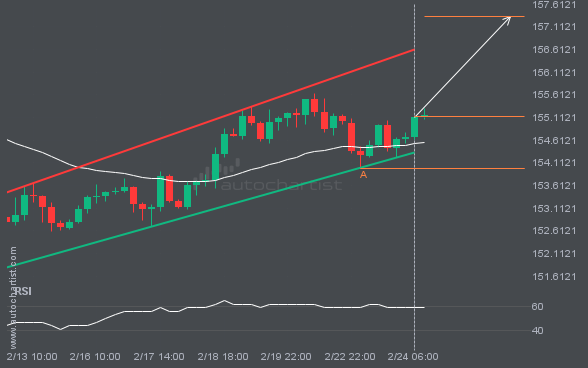
 USDJPY is moving toward a resistance line it has tested many times. It has retraced from this line before, so it’s unclear whether it will break through or rebound again. If USDJPY continues on its current trajectory, it could reach 157.3354 within the next 3 days.
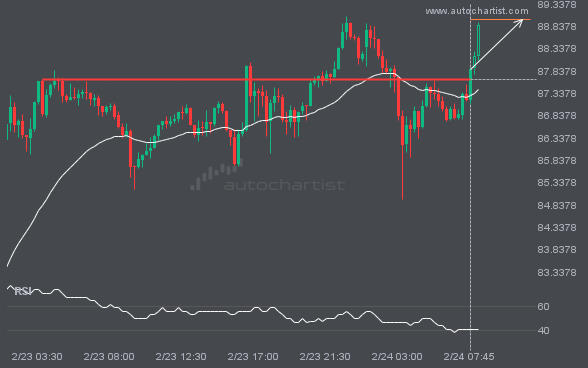
The price of XAGUSD is heading toward 89.0007. Despite the recent breakout through 87.6490, it may struggle to gain momentum to reach the forecast price and could move back in the other direction. This has happened many times in the past, so watch for a possible bounce back.
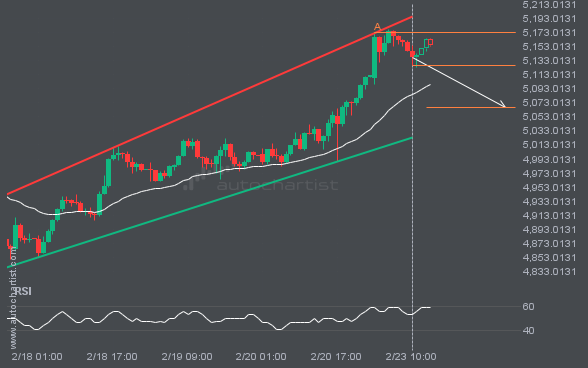
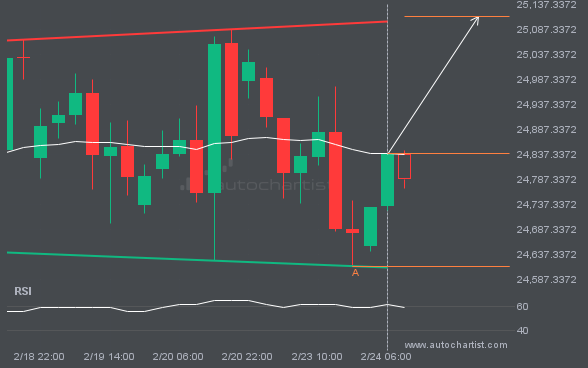
XAUUSD is moving toward a support line. Since it has retraced from this line before, we may see either a breakout through it or a rebound to current levels. It has touched this line multiple times in the past 8 days and may test it again within the next 23 hours.
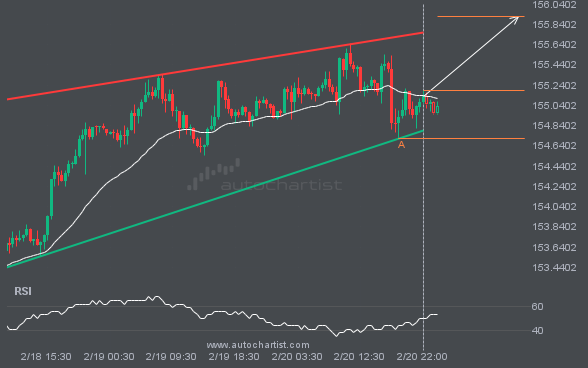
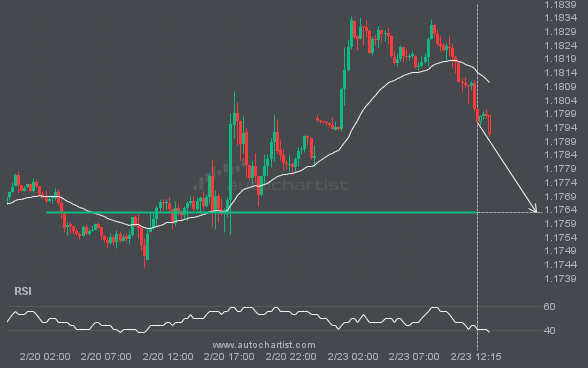
USDJPY is moving toward a resistance line it has tested many times. It has retraced from this line before, so it’s unclear whether it will break through or rebound again. If USDJPY continues on its current trajectory, it could reach 155.9163 within the next 16 hours.
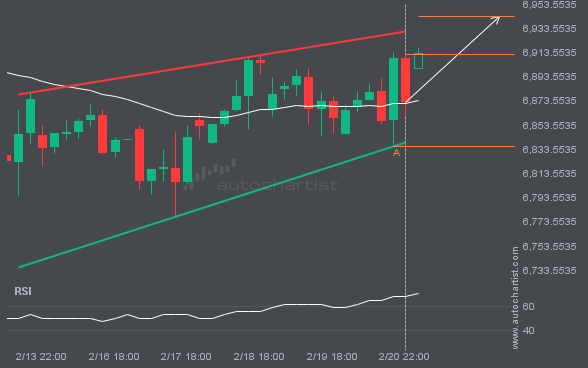
An emerging Rising Wedge pattern has been detected for S&P500 on the 4 hour chart. There may be a move toward 6943.1930 in the next few candles. Once it reaches the resistance, it may continue its bullish run or revert to current price levels.