Skip to content
 ETHUSD is moving towards a support line. Because we have seen it retrace from this line before, we could see either a break through this line, or a rebound back to current levels. It has touched this line numerous times in the last 7 days and may test it again within the next 2 days.
FTSE100 is moving towards a support line which it has tested numerous times in the past. We have seen it retrace from this line before, so at this stage it isn’t clear whether it will breach this line or rebound as it did before. If FTSE100 continues in its current trajectory, we could see it […]
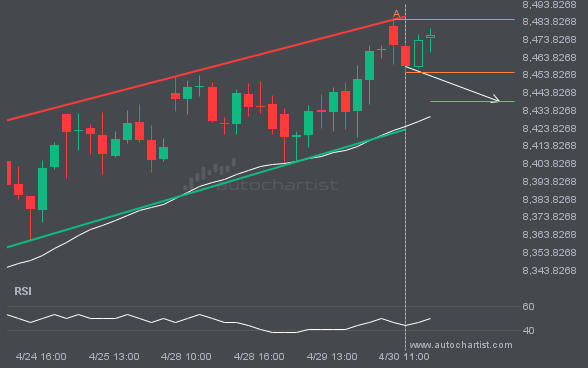
The breakout of XAUUSD through the 3291.6445 price line is a breach of an important psychological price that is has tested numerous in the past. If this breakout persists, XAUUSD could test 3206.8474 within the next 2 days. One should always be cautious before placing a trade, wait for confirmation of the breakout.
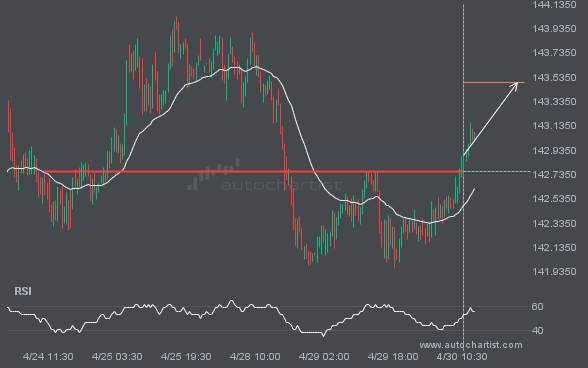
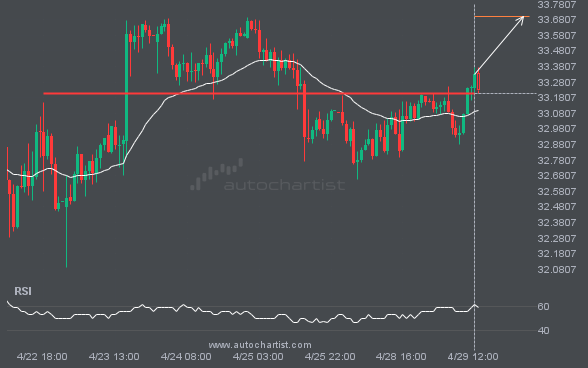
USDJPY has broken through 142.7600 which it has tested numerous times in the past. We have seen it retrace from this price in the past. If this new trend persists, USDJPY may be heading towards 143.4939 within the next 21 hours.
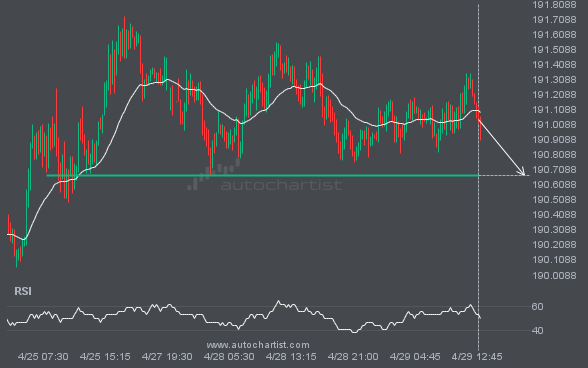
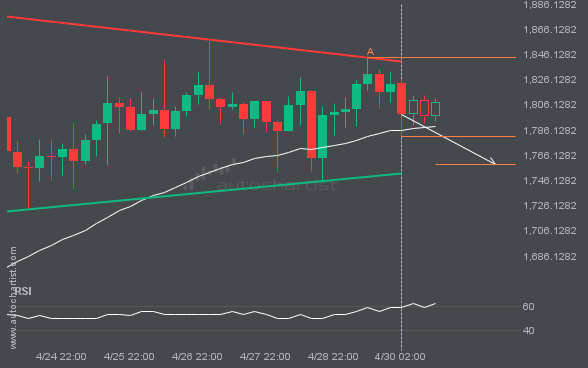
GBPJPY is heading towards 190.6690 and could reach this point within the next 13 hours. It has tested this line numerous times in the past, and this time could be no different, ending in a rebound instead of a breakout. If the breakout doesn’t happen, we could see a retracement back down to current levels.
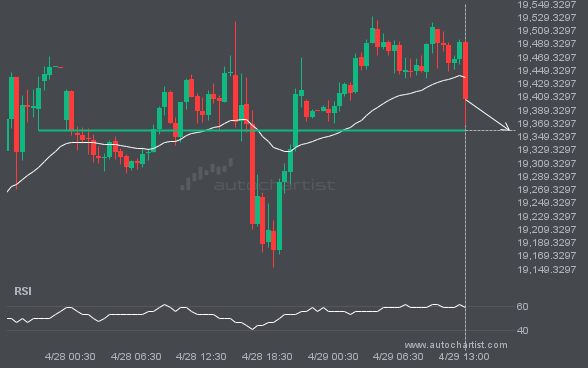
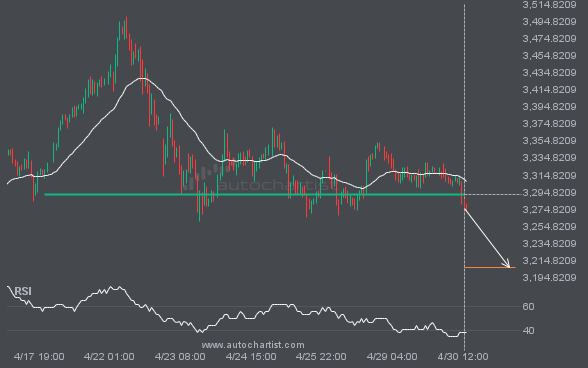
NAS100 is heading towards a line of 19358.1250. If this movement continues, the price of NAS100 could test 19358.1250 within the next 9 hours. But don’t be so quick to trade, it has tested this line numerous times in the past, so this movement could be short-lived and end up rebounding.