Skip to content
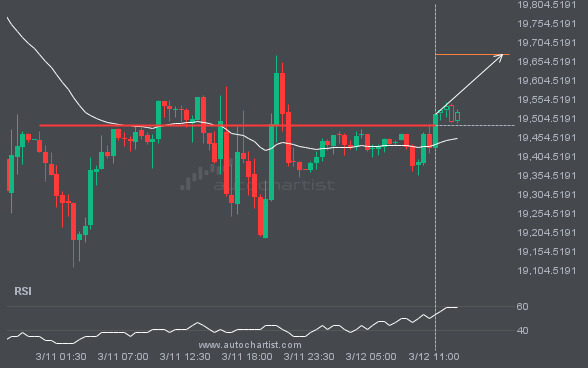
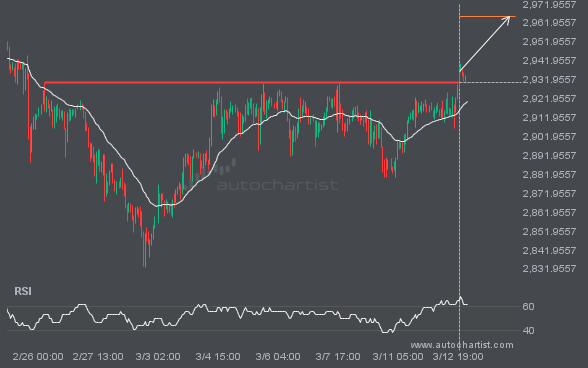
 The price of XAUUSD in heading in the direction of 2965.3269. Despite the recent breakout through 2930.5500 it is possible that it will struggle to gain momentum to the forecast price and move back in the other direction. This has happened many times in the past so watch for a possible bounce back.
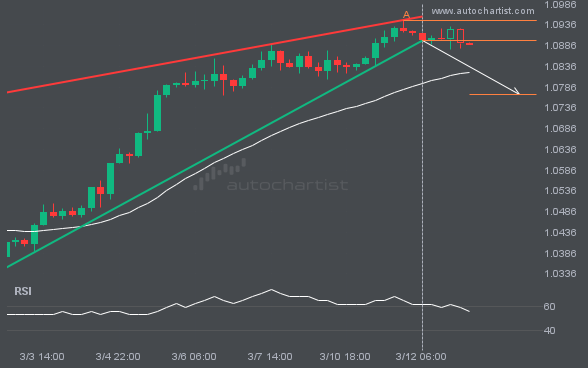
EURUSD moved through the support line of a Rising Wedge at 1.0897697222222225 on the 4 hour chart. This line has been tested a number of times in the past and this breakout could mean an upcoming change from the current trend. It may continue in its current direction toward 1.0768.
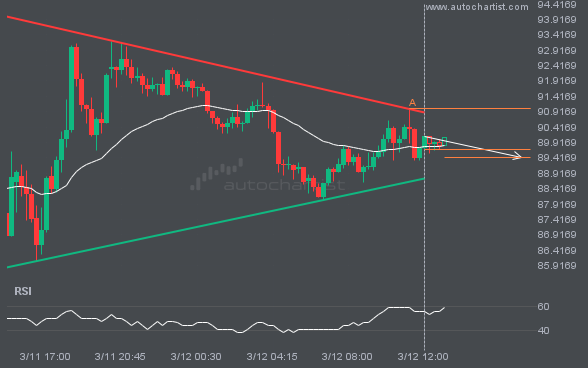
LTCUSD is heading towards the support line of a Triangle. If this movement continues, the price of LTCUSD could test 89.4303 within the next 5 hours. It has tested this line numerous times in the past, so this movement could be short-lived and end up rebounding just like it did in the past.
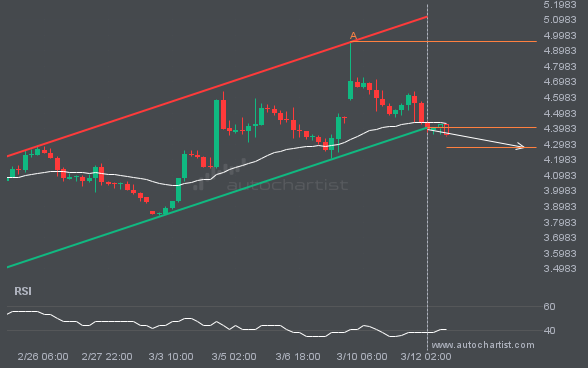
NGC/USD has broken through a support line of a Channel Up chart pattern. If this breakout holds true, we may see the price of NGC/USD testing 4.2802 within the next 3 days. But don’t be so quick to trade, it has tested this line in the past, so you should confirm the breakout before taking […]
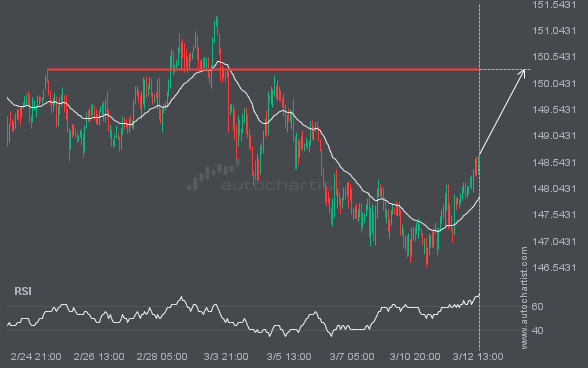
USDJPY is heading towards 150.3020 and could reach this point within the next 3 days. It has tested this line numerous times in the past, and this time could be no different, ending in a rebound instead of a breakout. If the breakout doesn’t happen, we could see a retracement back down to current levels.
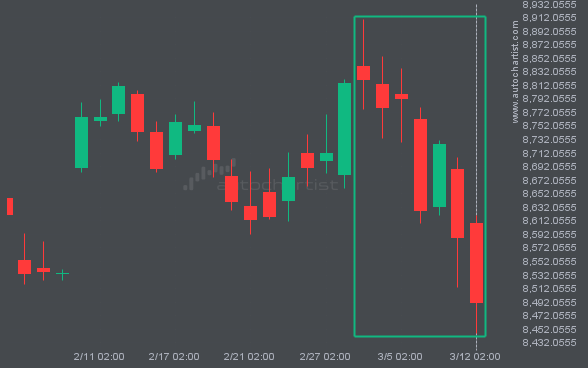
Those of you that are trend followers are probably eagerly watching FTSE100 to see if its latest 3.73% move continues. If not, the mean-reversion people out there will be delighted with this exceptionally large 10 days move.