Skip to content
 S&P500 has broken through the resistance line of a Falling Wedge technical chart pattern. Because we have seen it retrace from this line in the past, one should wait for confirmation of the breakout before taking any action. It has touched this line twice in the last 11 days and suggests a possible target level […]
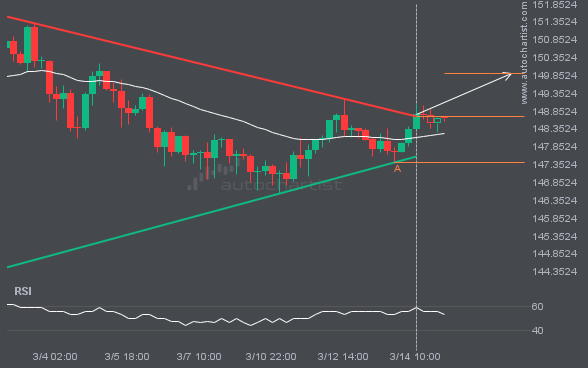
USDJPY moved through the resistance line of a Triangle at 148.70676744186045 on the 4 hour chart. This line has been tested a number of times in the past and this breakout could mean an upcoming change from the current trend. It may continue in its current direction toward 149.8931.
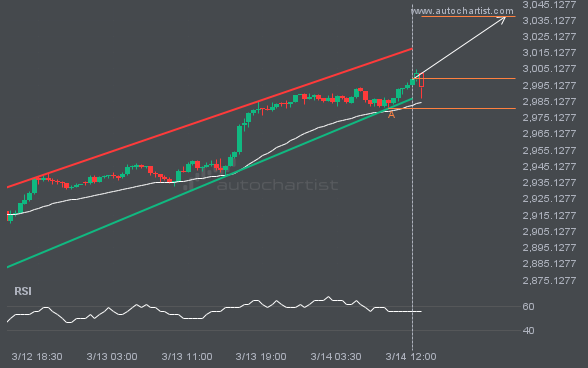
XAUUSD is heading towards the resistance line of a Channel Up and could reach this point within the next 12 hours. It has tested this line numerous times in the past, and this time could be no different from the past, ending in a rebound instead of a breakout. If the breakout doesn’t happen, we […]
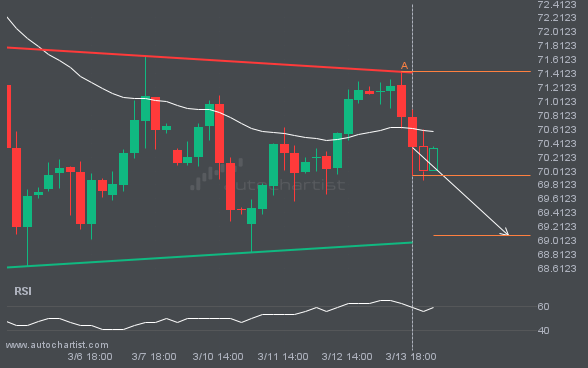
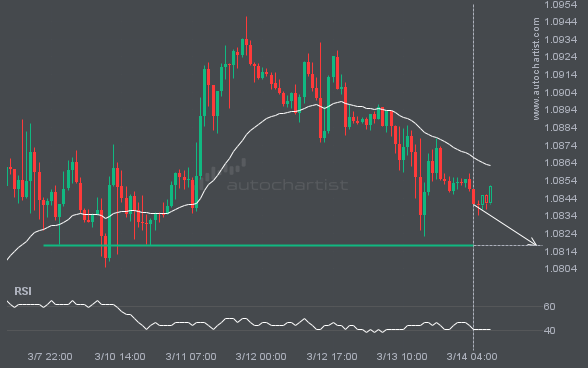
An emerging Triangle has been detected on BRN/USD on the 4 hour chart. There is a possible move towards 69.0799 next few candles. Once reaching resistance it may continue its bearish run or reverse back to current price levels.
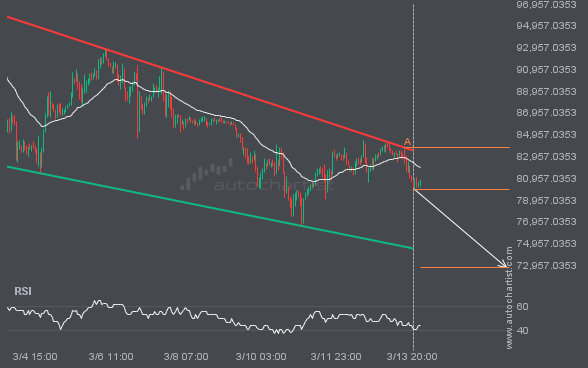
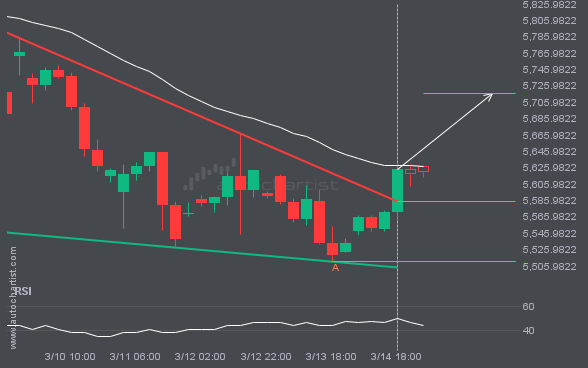
Emerging Falling Wedge pattern in its final wave was identified on the BTCUSD 1 hour chart. After a strong bearish run, we find BTCUSD heading towards the upper triangle line with a possible resistance at 72779.4596. If the support shows to hold, the Falling Wedge pattern suggests a rebound back towards current levels.
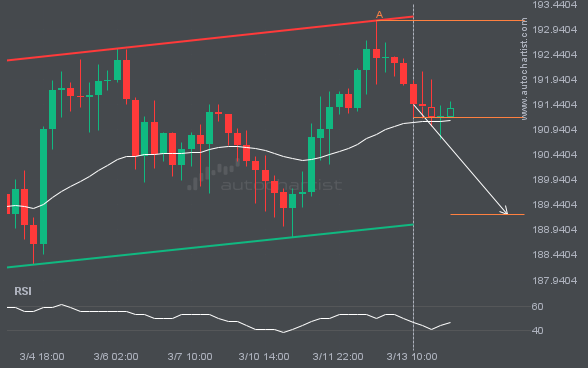
GBPJPY is heading towards the support line of a Channel Up. If this movement continues, the price of GBPJPY could test 189.2475 within the next 2 days. It has tested this line numerous times in the past, so this movement could be short-lived and end up rebounding just like it did in the past.