Skip to content
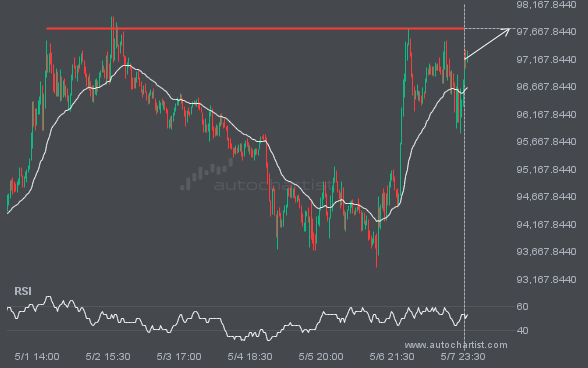
 BTCUSD is moving towards a key resistance level at 97720.0234. BTCUSD has previously tested this level 3 times and on each occasion it has bounced back off this level. Is this finally the time it will break through?
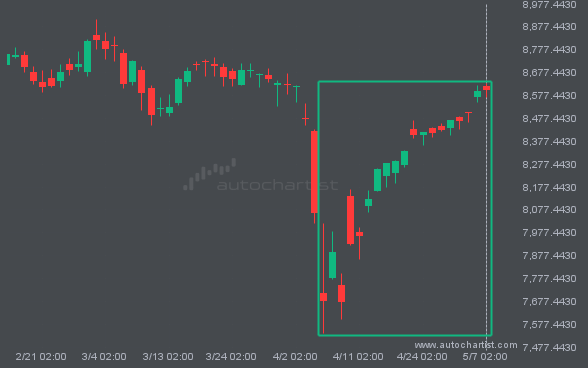
For those of you that don’t believe in trends, this may be an opportunity to take advantage of an exceptional 12.56% move on LTCUSD. The movement has happened over the last 2 days. For those trend followers among you, you may think about riding this possible trend.
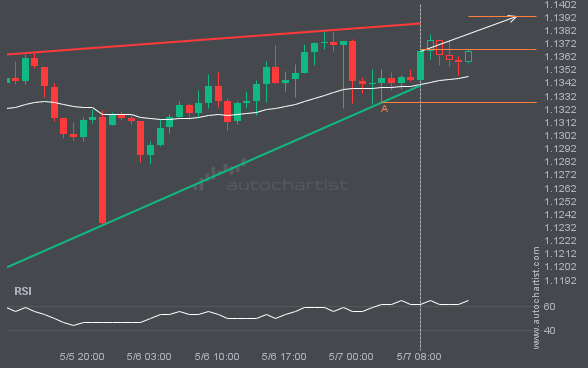
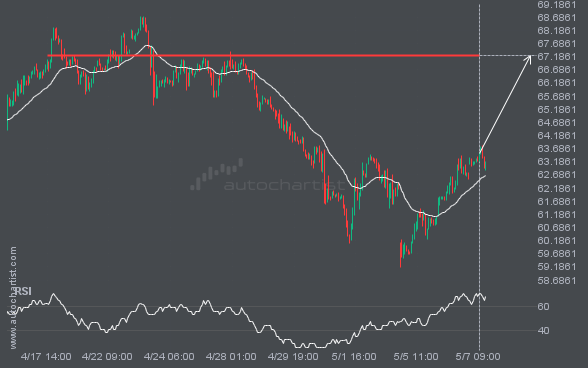
EURUSD is moving towards a resistance line. Because we have seen it retrace from this line before, we could see either a break through this line, or a rebound back to current levels. It has touched this line numerous times in the last 5 days and may test it again within the next 7 hours.
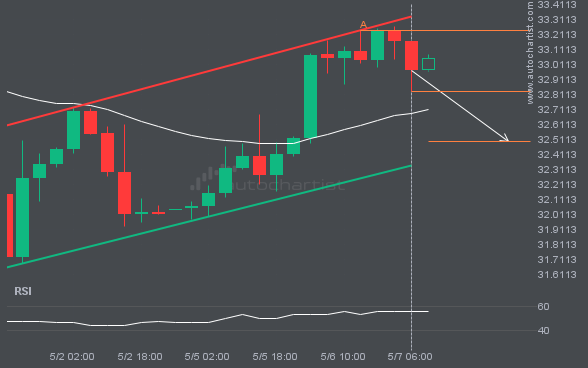
XAGUSD is moving towards a support line which it has tested numerous times in the past. We have seen it retrace from this line before, so at this stage it isn’t clear whether it will breach this line or rebound as it did before. If XAGUSD continues in its current trajectory, we could see it […]
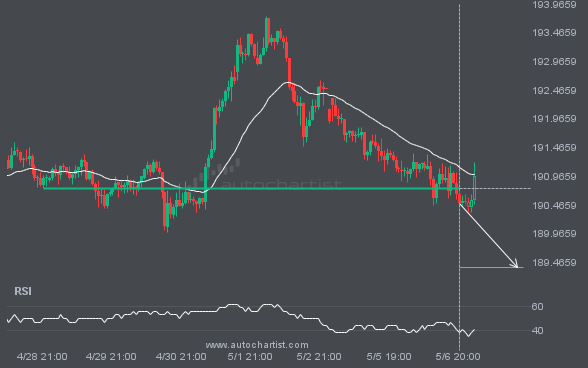
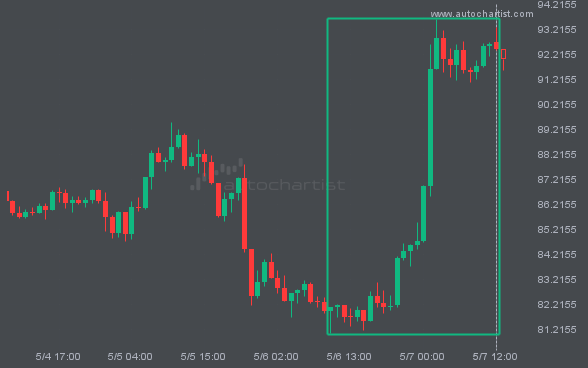
The price of GBPJPY in heading in the direction of 189.3802. Despite the recent breakout through 190.7575 it is possible that it will struggle to gain momentum to the forecast price and move back in the other direction. This has happened many times in the past so watch for a possible bounce back.