Skip to content
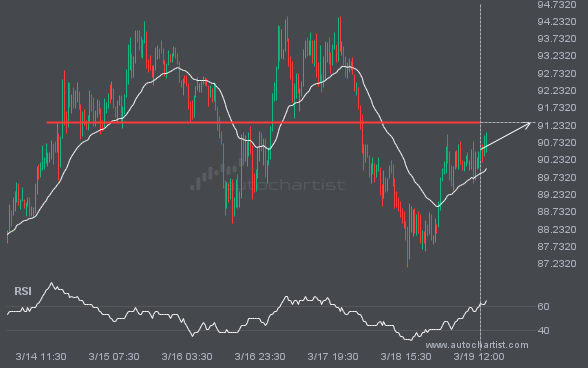
 FTSE100 is moving towards a line of 8738.9004 which it has tested numerous times in the past. We have seen it retrace from this position in the past, so at this stage it isn’t clear whether it will breach this price or rebound as it did before. If FTSE100 continues in its current trajectory, we […]
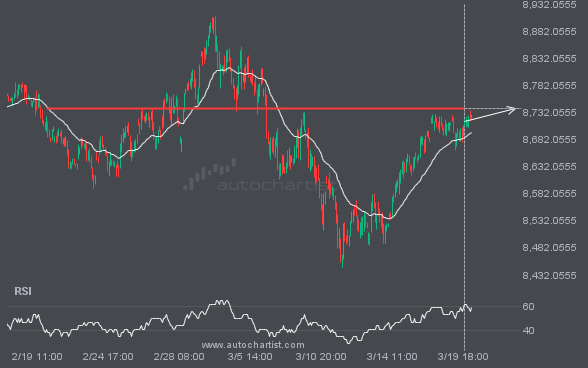

The price of BTCUSD in heading in the direction of 87130.4766. Despite the recent breakout through 84688.8203 it is possible that it will struggle to gain momentum to the forecast price and move back in the other direction. This has happened many times in the past so watch for a possible bounce back.
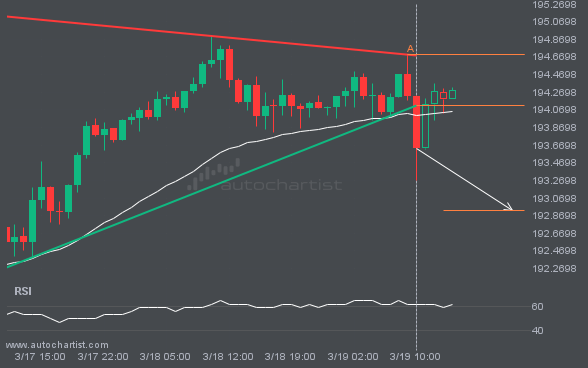
GBPJPY moved through the support line of a Triangle at 194.11339999999998 on the 1 hour chart. This line has been tested a number of times in the past and this breakout could mean an upcoming change from the current trend. It may continue in its current direction toward 192.9295.
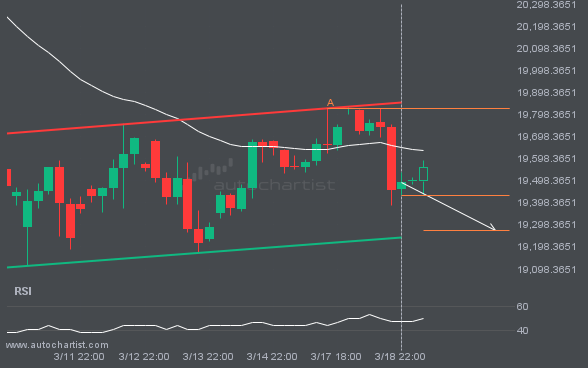
NAS100 is heading towards the support line of a Channel Up and could reach this point within the next 2 days. It has tested this line numerous times in the past, and this time could be no different from the past, ending in a rebound instead of a breakout. If the breakout doesn’t happen, we […]
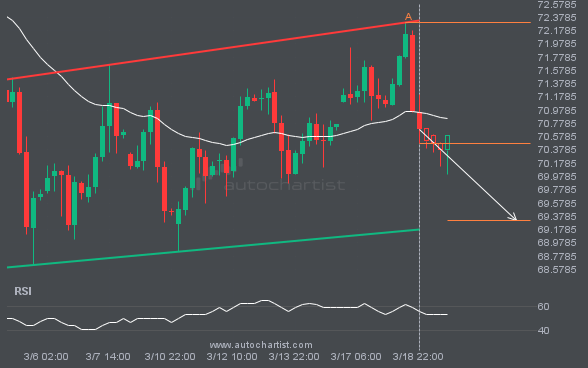
Emerging Channel Up detected on BRN/USD – the pattern is an emerging one and has not yet broken through resistance, but the price is expected to move up over the next few hours. The price at the time the pattern was found was 70.482 and it is expected to move to 69.3203.
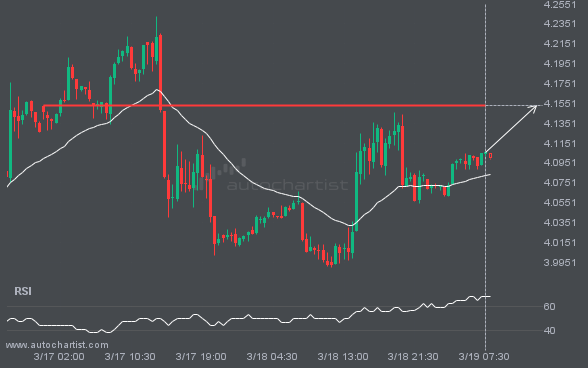
NGC/USD is moving towards a line of 4.1530 which it has tested numerous times in the past. We have seen it retrace from this position in the past, so at this stage it isn’t clear whether it will breach this price or rebound as it did before. If NGC/USD continues in its current trajectory, we […]