Skip to content
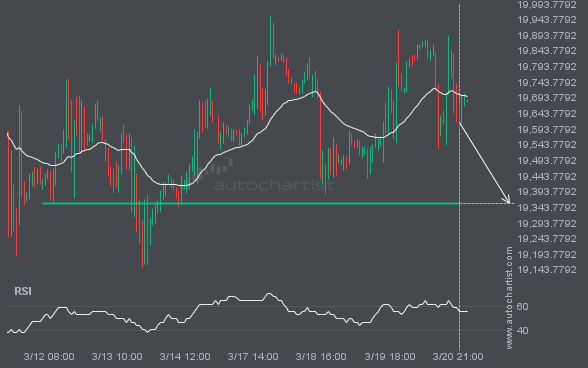
 NAS100 is moving towards a support line. Because we have seen it retrace from this level in the past, we could see either a break through this line, or a rebound back to current levels. It has touched this line numerous times in the last 9 days and may test it again within the next […]
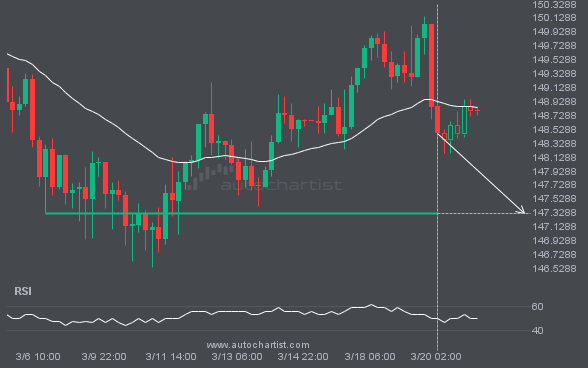
USDJPY is heading towards a line of 147.3150. If this movement continues, the price of USDJPY could test 147.3150 within the next 2 days. But don’t be so quick to trade, it has tested this line numerous times in the past, so this movement could be short-lived and end up rebounding.
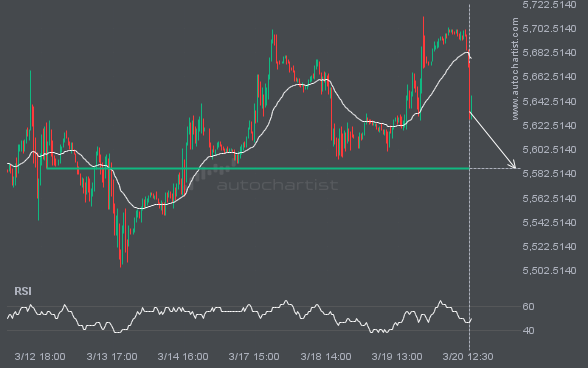
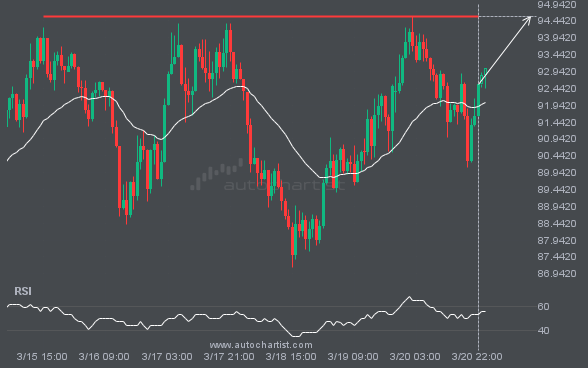
The movement of S&P500 towards 5586.6802 price line is yet another test of the line it reached numerous times in the past. We could expect this test to happen in the next 2 days, but it is uncertain whether it will result in a breakout through this line, or simply rebound back to current lines.
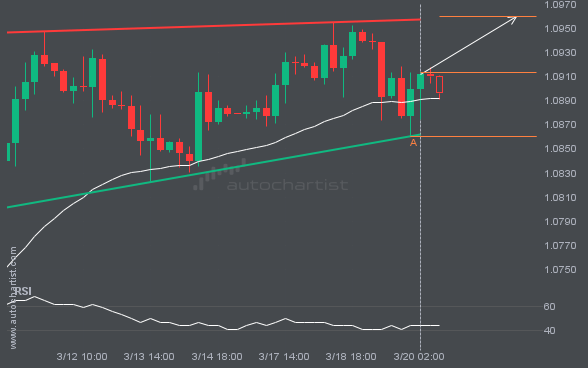
Emerging Ascending Triangle detected on EURUSD – the pattern is an emerging one and has not yet broken through support, but the price is expected to move up over the next few hours. The price at the time the pattern was found was 1.09133 and it is expected to move to 1.0959.
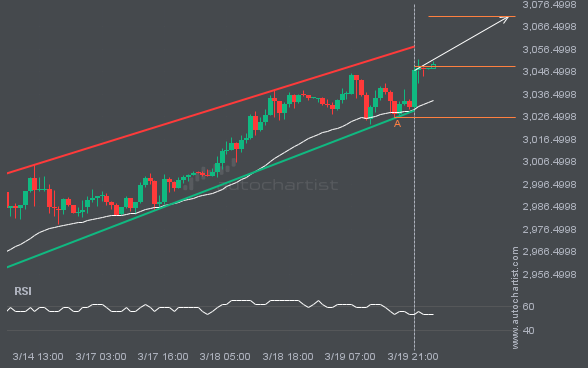
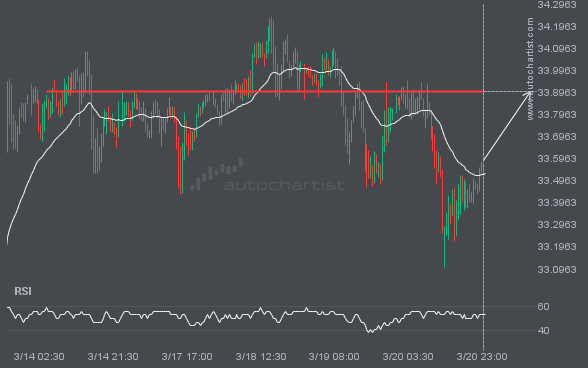
XAUUSD is approaching the resistance line of a Channel Up. It has touched this line numerous times in the last 8 days. If it tests this line again, it should do so in the next 23 hours.