 Skip to content
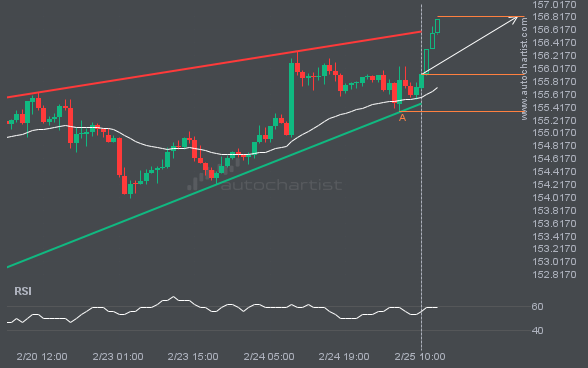
 An emerging Rising Wedge pattern in its final wave has been identified on the USDJPY 1 hour chart. After a strong bullish run, USDJPY is heading toward the upper triangle trendline, with possible resistance at 156.8224. If the resistance holds, the Rising Wedge pattern suggests a rebound toward current levels.
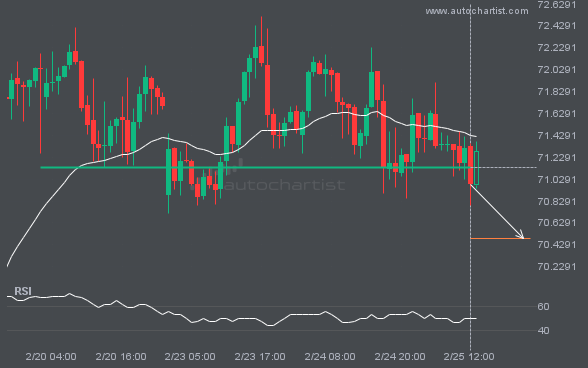
BRN/USD has broken through a support line. Because it has previously retraced from this price, you should wait for confirmation of the breakout before trading. It has touched this line multiple times over the past 6 days, which suggests a possible target around 70.4855 within the next 17 hours.
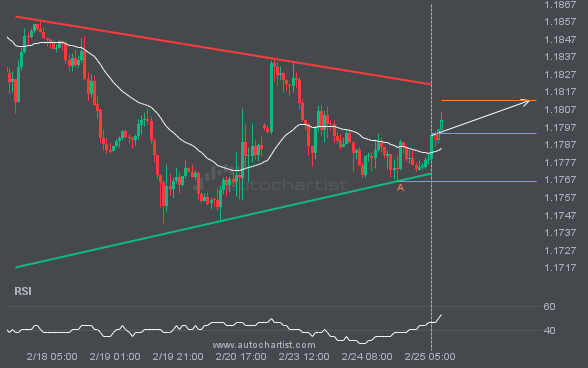
EURUSD is moving toward a resistance line. Since it has retraced from this line before, we may see either a breakout through it or a rebound to current levels. It has touched this line multiple times in the past 8 days and may test it again within the next 2 days.
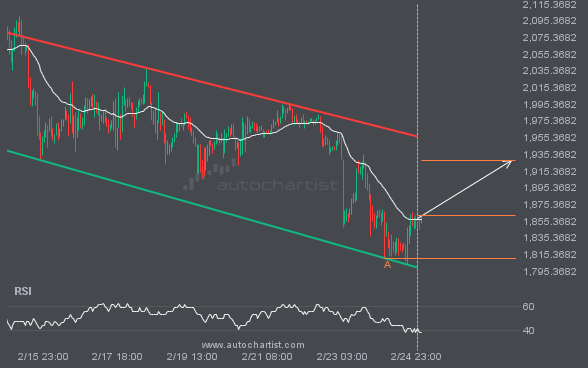
ETHUSD is heading toward the resistance line in a Channel Down pattern. If this move continues, the price of ETHUSD could test 1927.7262 within the next 3 days. It has tested this line many times before, so the move could be short-lived and may rebound as it has before.
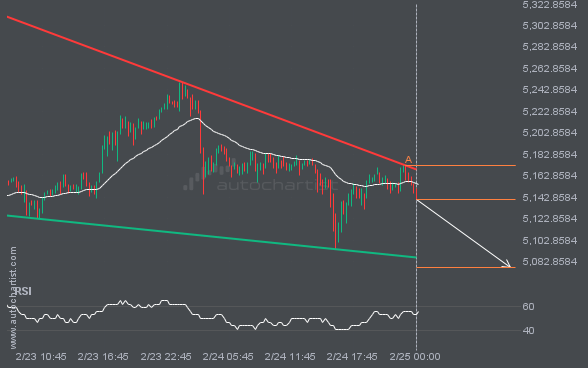
XAUUSD is moving toward a support line. Since it has retraced from this line before, we may see either a breakout through it or a rebound to current levels. It has touched this line multiple times in the past 2 days and may test it again within the next 12 hours.
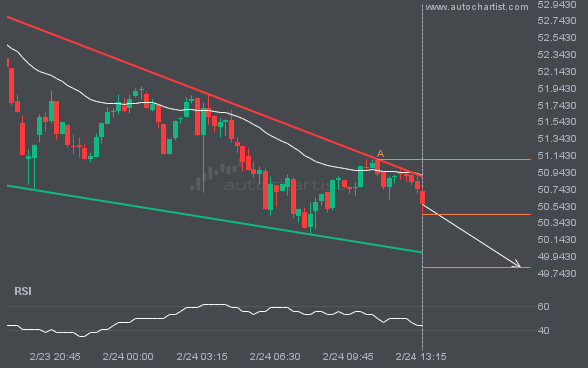
LTCUSD is moving toward a support line. Since it has retraced from this line before, we may see either a breakout through it or a rebound to current levels. It has touched this line multiple times in the past 20 hours and may test it again within the next 5 hours.
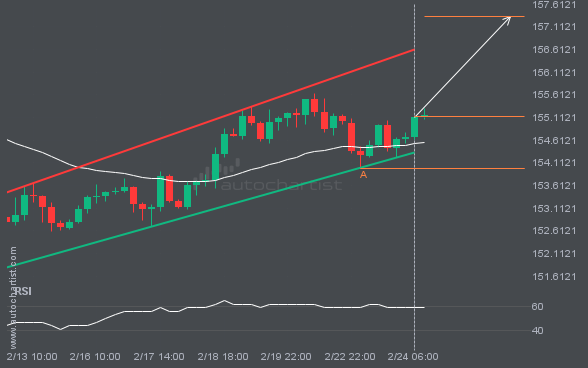
USDJPY is moving toward a resistance line it has tested many times. It has retraced from this line before, so it’s unclear whether it will break through or rebound again. If USDJPY continues on its current trajectory, it could reach 157.3354 within the next 3 days.

