Skip to content
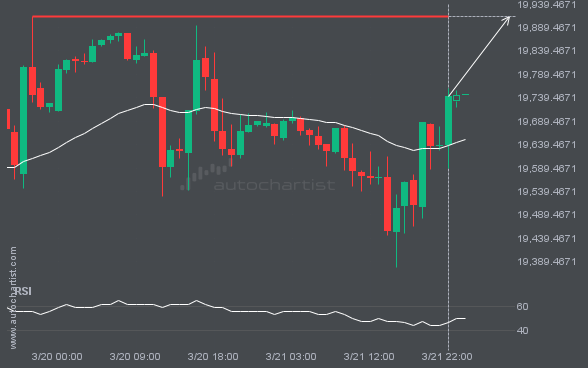
 NAS100 is moving towards a resistance line. Because we have seen it retrace from this level in the past, we could see either a break through this line, or a rebound back to current levels. It has touched this line numerous times in the last 3 days and may test it again within the next […]
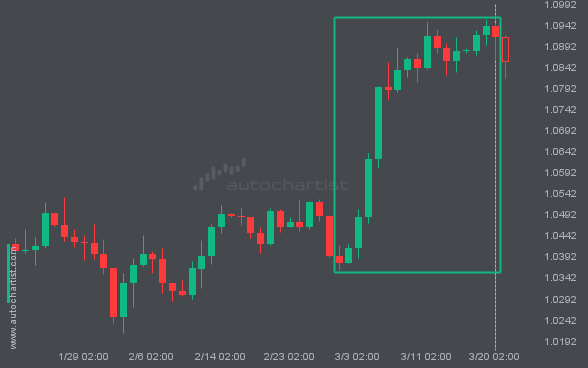
Those of you that are trend followers are probably eagerly watching EURUSD to see if its latest 5.16% move continues. If not, the mean-reversion people out there will be delighted with this exceptionally large 21 days move.
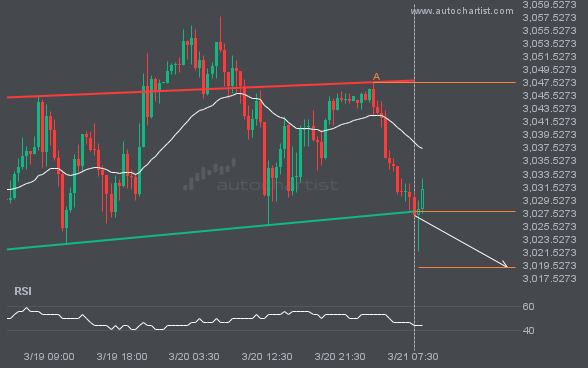
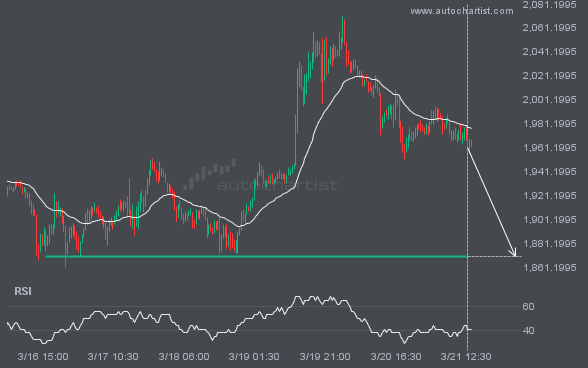
The last 7 30 Minutes candles on XAUUSD formed a Head and Shoulders pattern and broken out through the pattern lines, indicating a possible bearish movement towards the price level of 3019.2536.
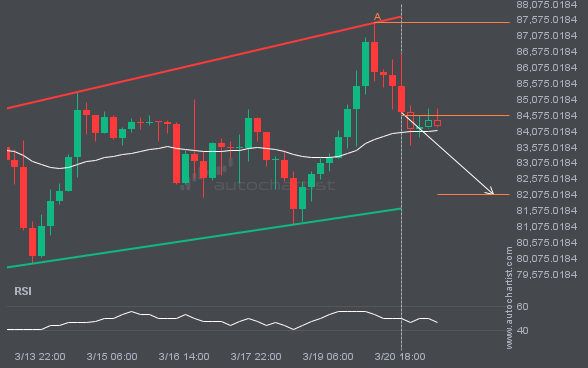
BTCUSD is approaching the support line of a Channel Up. It has touched this line numerous times in the last 9 days. If it tests this line again, it should do so in the next 2 days.
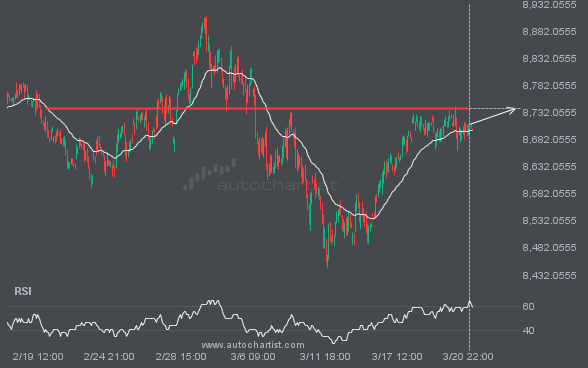
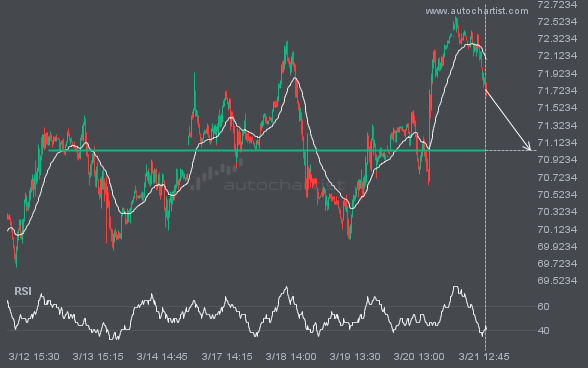
FTSE100 is about to retest a key horizontal resistance level near 8738.9004. It has tested this level 5 times in the recent past and could simply bounce off like it did last time. However, after this many tries, maybe it’s ready to start a new trend.