Skip to content
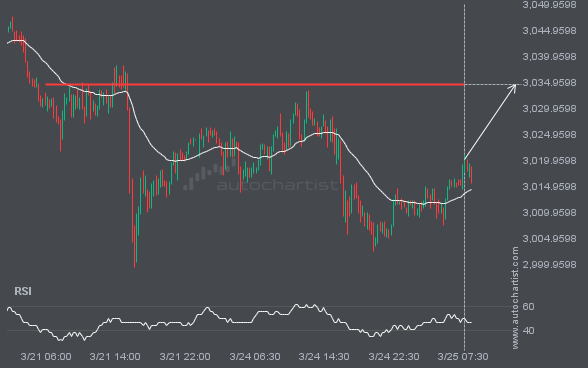
 The movement of XAUUSD towards 3034.4446 price line is yet another test of the line it reached numerous times in the past. We could expect this test to happen in the next 11 hours, but it is uncertain whether it will result in a breakout through this line, or simply rebound back to current lines.
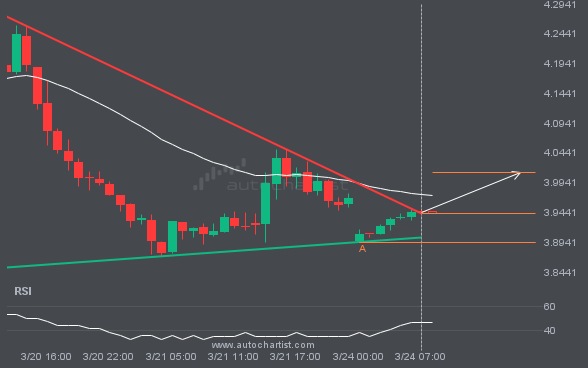
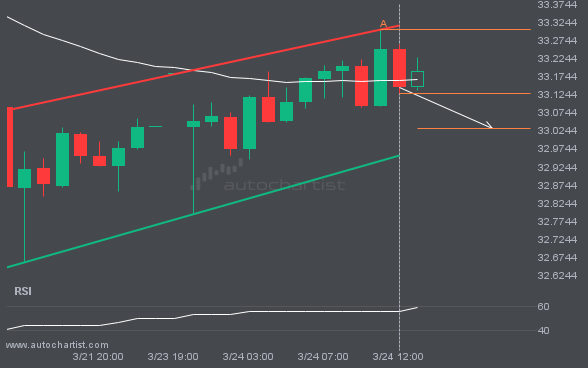
NGC/USD has broken through the resistance line of a Triangle technical chart pattern. Because we have seen it retrace from this line in the past, one should wait for confirmation of the breakout before taking any action. It has touched this line twice in the last 6 days and suggests a possible target level to […]
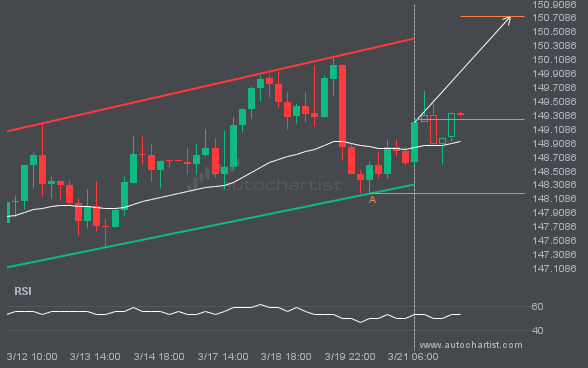
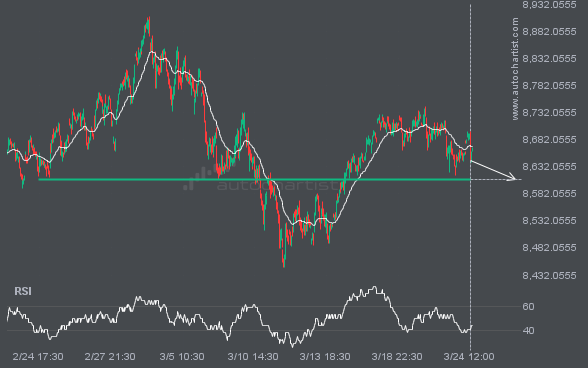
The movement of USDJPY towards the resistance line of a Channel Up is yet another test of the line it reached numerous times in the past. This line test could happen in the next 2 days, but it is uncertain whether it will result in a breakout through this line, or simply rebound back to […]
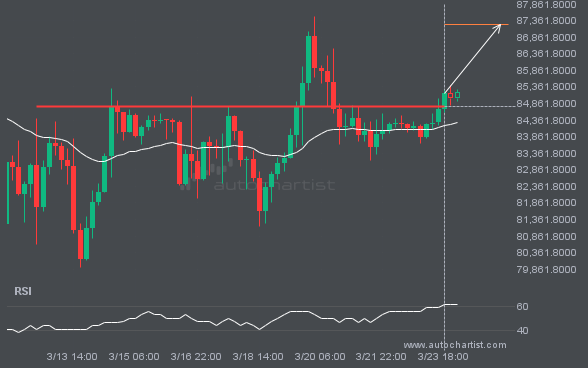
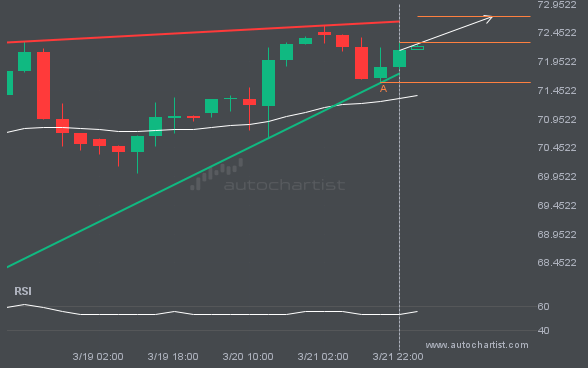
BTCUSD has broken through a line of 84760.9766. If this breakout holds true, we could see the price of BTCUSD heading towards 87253.0938 within the next 3 days. But don’t be so quick to trade, it has tested this line numerous times in the past, so you should probably confirm the breakout before placing any […]