 Skip to content
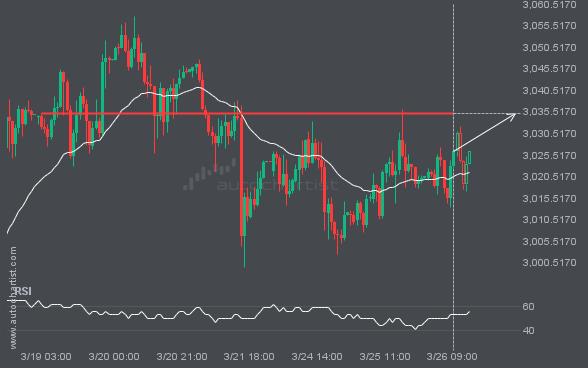
 XAUUSD is heading towards a line of 3035.1599. If this movement continues, the price of XAUUSD could test 3035.1599 within the next 2 days. But don’t be so quick to trade, it has tested this line numerous times in the past, so this movement could be short-lived and end up rebounding.

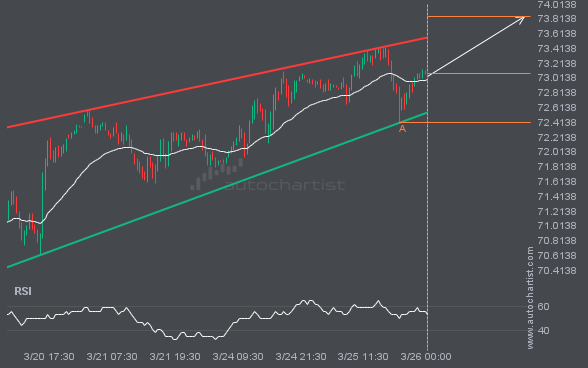
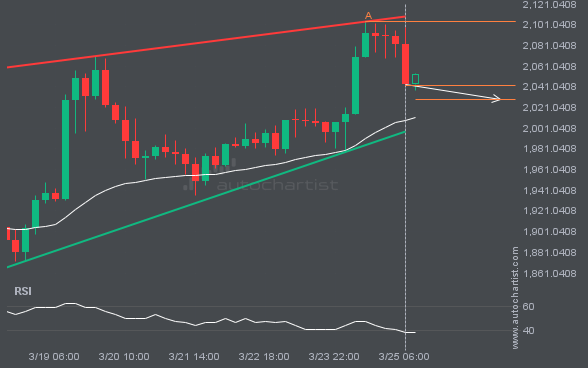
Emerging Ascending Triangle pattern in its final wave was identified on the GBPJPY 1 hour chart. After a strong bullish run, we find GBPJPY heading towards the upper triangle line with a possible resistance at 195.0595. If the resistance shows to hold, the Ascending Triangle pattern suggests a rebound back towards current levels.
BRN/USD is heading towards the resistance line of a Rising Wedge and could reach this point within the next 2 days. It has tested this line numerous times in the past, and this time could be no different from the past, ending in a rebound instead of a breakout. If the breakout doesn’t happen, we […]
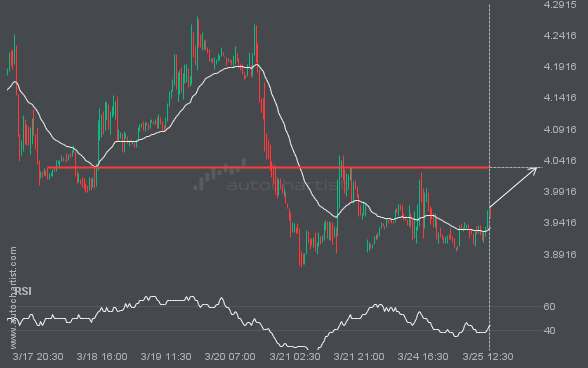
The movement of NGC/USD towards 4.0295 price line is yet another test of the line it reached numerous times in the past. We could expect this test to happen in the next 2 days, but it is uncertain whether it will result in a breakout through this line, or simply rebound back to current lines.
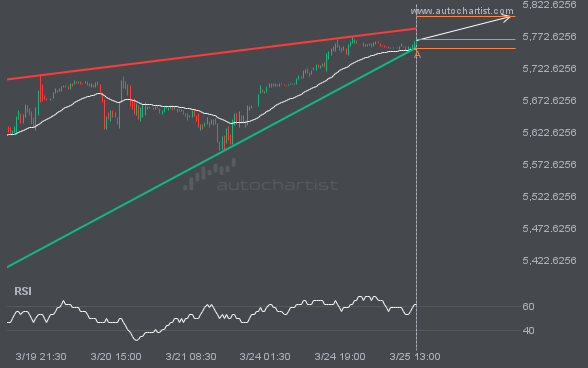
S&P500 was identified at around 5766.8 having recently rebounded of the support on the 30 Minutes data interval. Ultimately, the price action of the stock has formed a Rising Wedge pattern. This squeeze may increases the chances of a strong breakout. The projected movement will potentially take the price to around the 5803.0782 level.
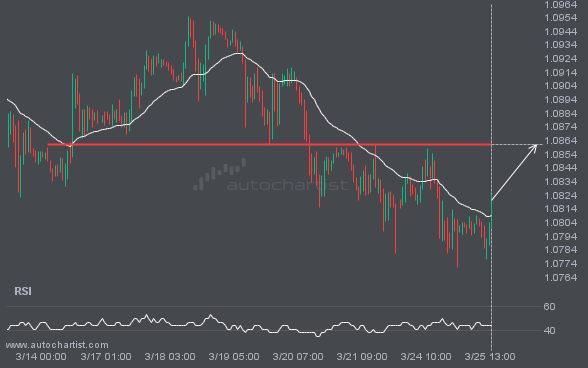
EURUSD is about to retest a key horizontal resistance level near 1.0861. It has tested this level 6 times in the recent past and could simply bounce off like it did last time. However, after this many tries, maybe it’s ready to start a new trend.
ETHUSD is moving towards a support line. Because we have seen it retrace from this line before, we could see either a break through this line, or a rebound back to current levels. It has touched this line numerous times in the last 8 days and may test it again within the next 2 days.

