Skip to content
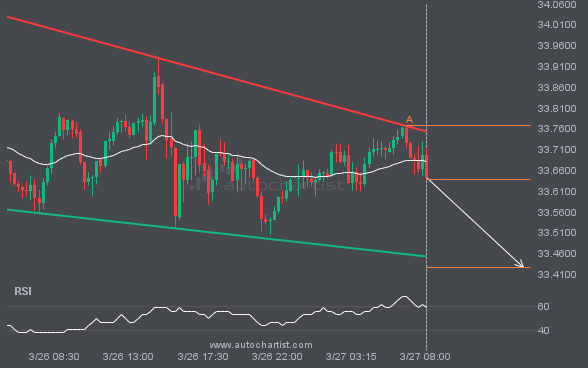
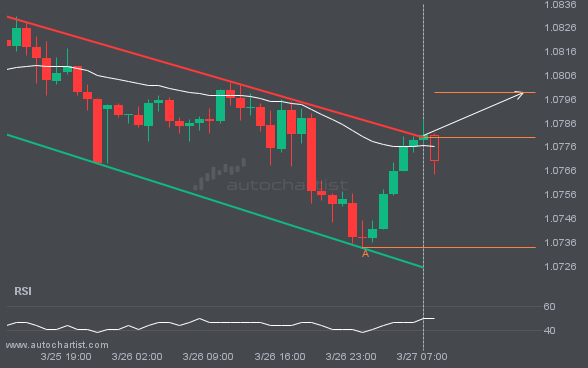
The movement of XAGUSD towards the support line of a Falling Wedge is yet another test of the line it reached numerous times in the past. This line test could happen in the next 8 hours, but it is uncertain whether it will result in a breakout through this line, or simply rebound back to […]
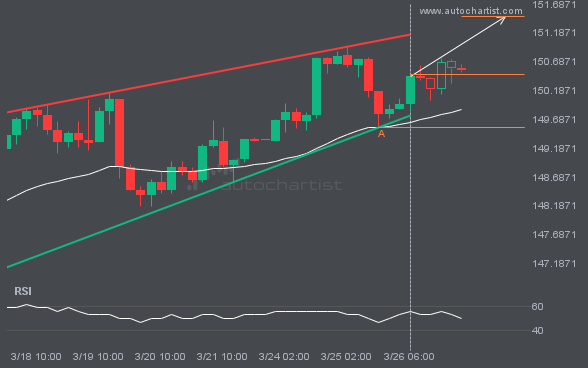
Emerging Rising Wedge pattern in its final wave was identified on the USDJPY 4 hour chart. After a strong bullish run, we find USDJPY heading towards the upper triangle line with a possible resistance at 151.4696. If the resistance shows to hold, the Rising Wedge pattern suggests a rebound back towards current levels.
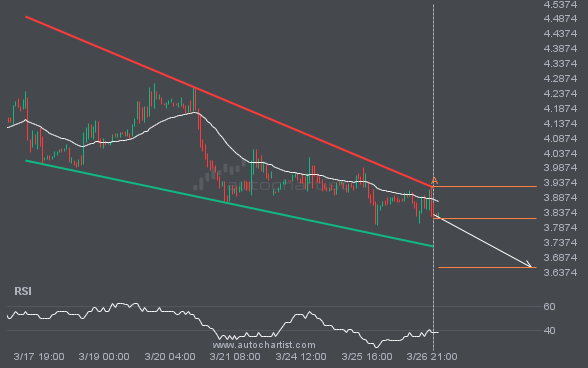
NGC/USD is heading towards the support line of a Falling Wedge. If this movement continues, the price of NGC/USD could test 3.6538 within the next 3 days. It has tested this line numerous times in the past, so this movement could be short-lived and end up rebounding just like it did in the past.
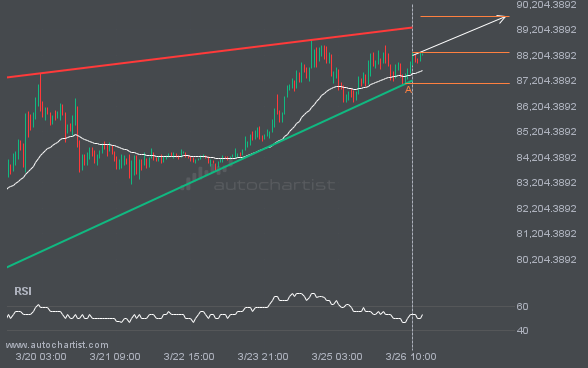
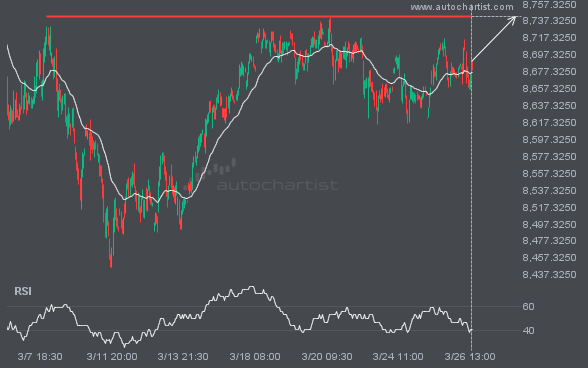
BTCUSD is moving towards a resistance line. Because we have seen it retrace from this line before, we could see either a break through this line, or a rebound back to current levels. It has touched this line numerous times in the last 8 days and may test it again within the next 2 days.