Skip to content
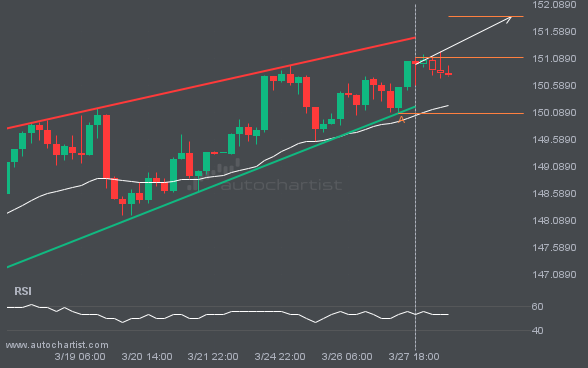
 A Rising Wedge pattern was identified on USDJPY at 151.0935, creating an expectation that it may move to the resistance line at 151.8567. It may break through that line and continue the bullish trend or it may reverse from that line.
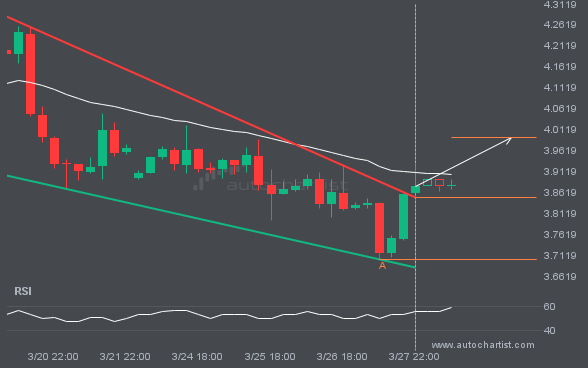
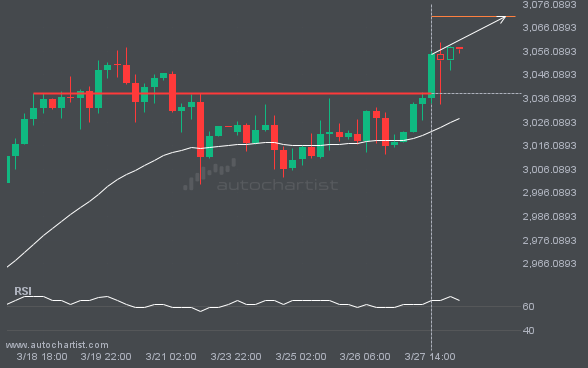
NGC/USD has broken through a resistance line of a Falling Wedge chart pattern. If this breakout holds true, we may see the price of NGC/USD testing 3.9929 within the next 2 days. But don’t be so quick to trade, it has tested this line in the past, so you should confirm the breakout before taking […]
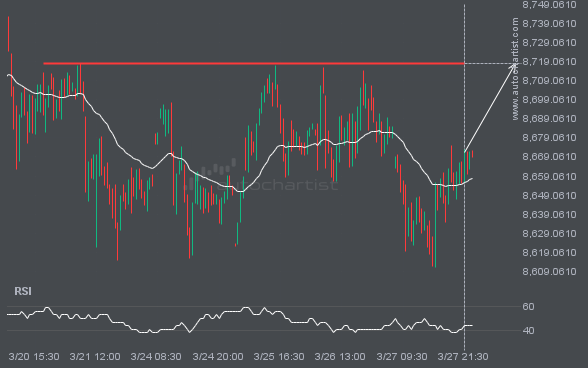
FTSE100 is moving towards a key resistance level at 8717.7002. FTSE100 has previously tested this level 5 times and on each occasion it has bounced back off this level. Is this finally the time it will break through?
LTCUSD is moving towards a support line. Because we have seen it retrace from this level in the past, we could see either a break through this line, or a rebound back to current levels. It has touched this line numerous times in the last 5 days and may test it again within the next […]
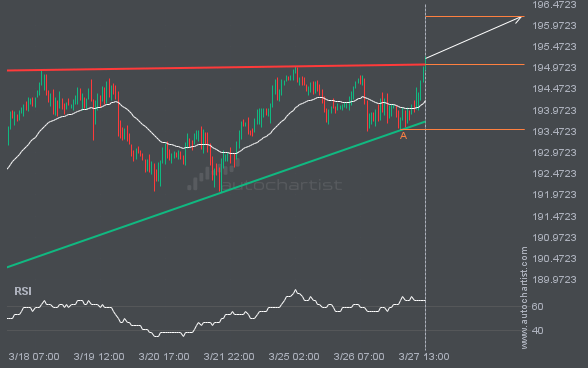
This trade setup on GBPJPY is formed by a period of consolidation; a period in which the price primarily moves sideways before choosing a new direction for the longer term. Because of the bullish breakout through resistance, it seems to suggest that we could see the next price move to 196.1765.