 Skip to content
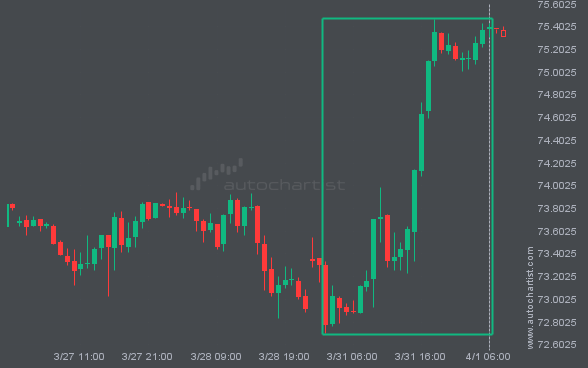
 Those of you that are trend followers are probably eagerly watching BRN/USD to see if its latest 3.61% move continues. If not, the mean-reversion people out there will be delighted with this exceptionally large 2 days move.
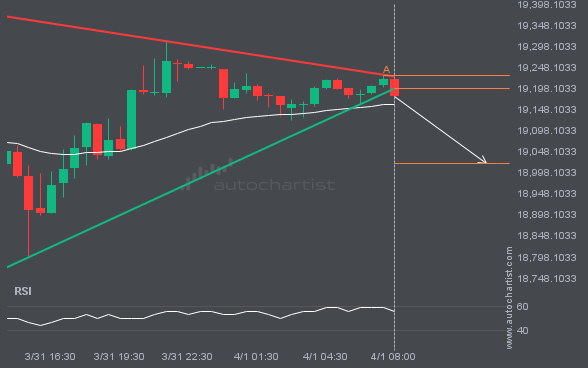
This trade setup on NAS100 is formed by a period of consolidation; a period in which the price primarily moves sideways before choosing a new direction for the longer term. Because of the bearish breakout through support, it seems to suggest that we could see the next price move to 19019.4101.
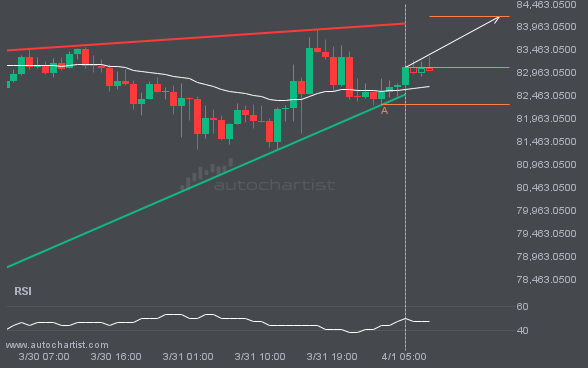
A Rising Wedge pattern was identified on BTCUSD at 83088.58, creating an expectation that it may move to the resistance line at 84190.3178. It may break through that line and continue the bullish trend or it may reverse from that line.
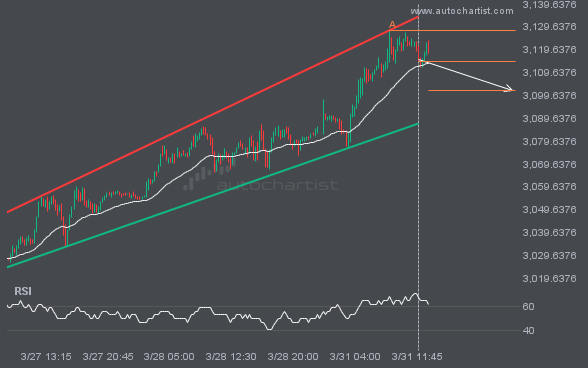
XAUUSD is moving towards a support line which it has tested numerous times in the past. We have seen it retrace from this line before, so at this stage it isn’t clear whether it will breach this line or rebound as it did before. If XAUUSD continues in its current trajectory, we could see it […]
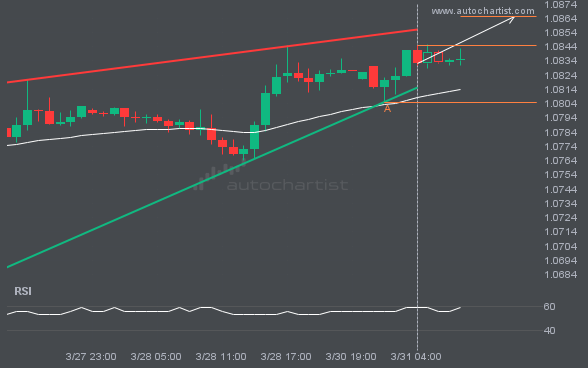
Emerging Rising Wedge pattern in its final wave was identified on the EURUSD 1 hour chart. After a strong bullish run, we find EURUSD heading towards the upper triangle line with a possible resistance at 1.0865. If the resistance shows to hold, the Rising Wedge pattern suggests a rebound back towards current levels.
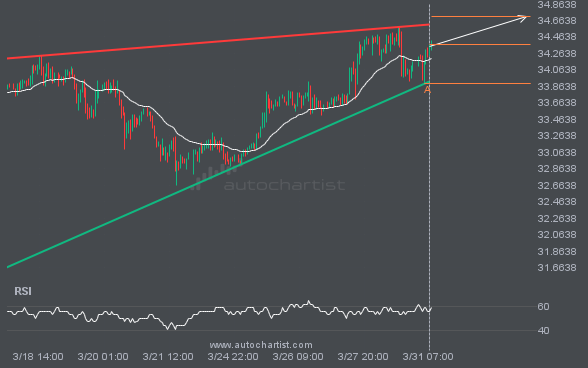
XAGUSD is approaching the resistance line of a Rising Wedge. It has touched this line numerous times in the last 14 days. If it tests this line again, it should do so in the next 3 days.
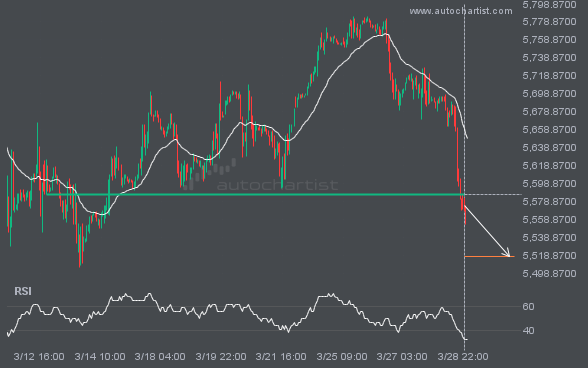
The breakout of S&P500 through the 5586.6802 price line is a breach of an important psychological price that is has tested numerous in the past. If this breakout persists, S&P500 could test 5517.3970 within the next 3 days. One should always be cautious before placing a trade, wait for confirmation of the breakout.

