 Skip to content
 BRN/USD is moving towards a support line. Because we have seen it retrace from this line before, we could see either a break through this line, or a rebound back to current levels. It has touched this line numerous times in the last 22 hours and may test it again within the next 5 hours.
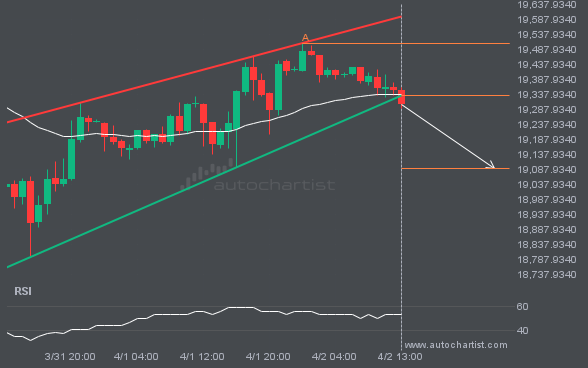
NAS100 has broken through a support line of a Rising Wedge and suggests a possible movement to 19089.9198 within the next 14 hours. It has tested this line in the past, so one should probably wait for a confirmation of this breakout before taking action. If the breakout doesn’t confirm, we could see a retracement […]
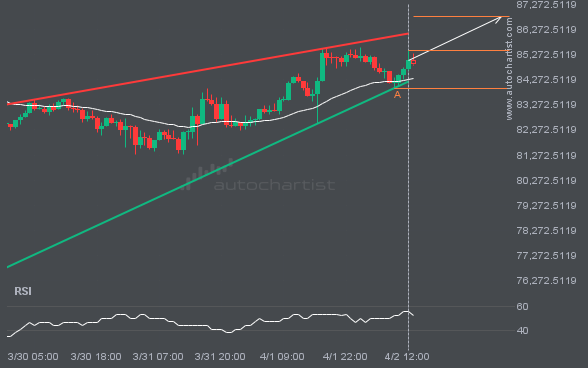
A Rising Wedge pattern was identified on BTCUSD at 85432.83, creating an expectation that it may move to the resistance line at 86774.0588. It may break through that line and continue the bullish trend or it may reverse from that line.
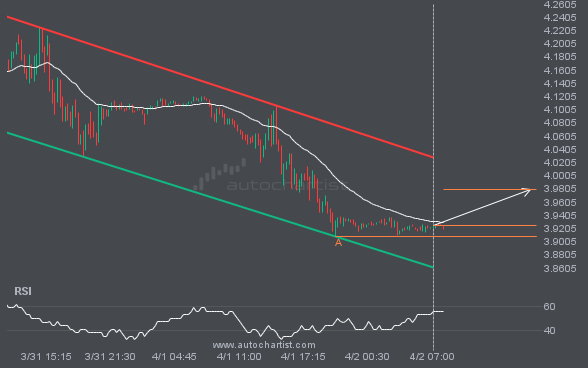
A Channel Down pattern was identified on NGC/USD at 3.9255, creating an expectation that it may move to the resistance line at 3.9792. It may break through that line and continue the bullish trend or it may reverse from that line.
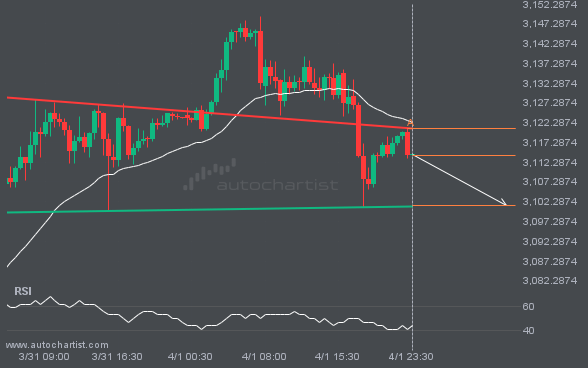
XAUUSD is heading towards the support line of a Head and Shoulders and could reach this point within the next 12 hours. It has tested this line numerous times in the past, and this time could be no different from the past, ending in a rebound instead of a breakout. If the breakout doesn’t happen, […]
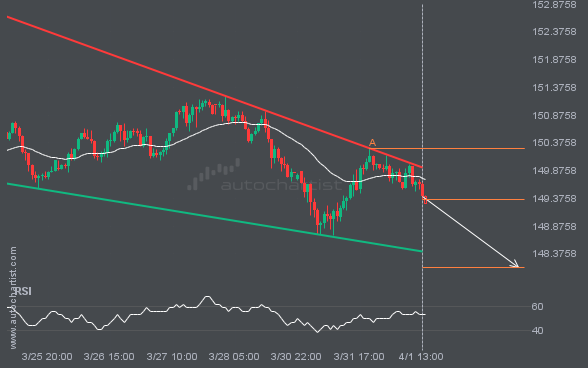
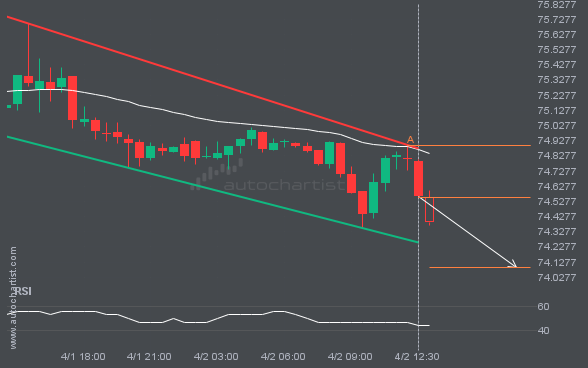
USDJPY is heading towards the support line of a Falling Wedge and could reach this point within the next 2 days. It has tested this line numerous times in the past, and this time could be no different from the past, ending in a rebound instead of a breakout. If the breakout doesn’t happen, we […]
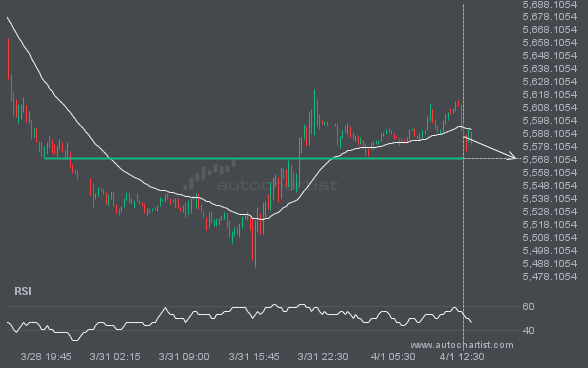
S&P500 is moving towards a support line. Because we have seen it retrace from this level in the past, we could see either a break through this line, or a rebound back to current levels. It has touched this line numerous times in the last 4 days and may test it again within the next […]

