Skip to content
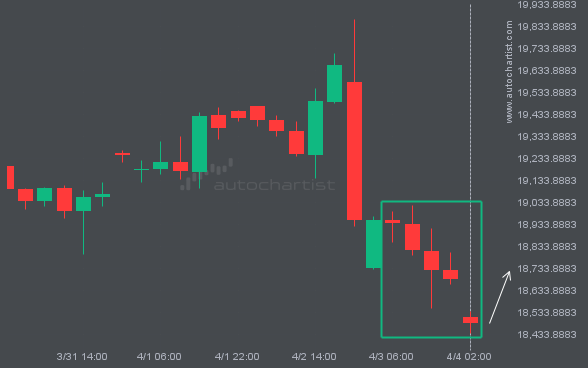
NAS100 has experienced an unusual quantity of bearish candles on the 4 hour timeframe. This is in the 0.949999988079071 percentile of movements and so we could see a slight pullback over the next few candles.
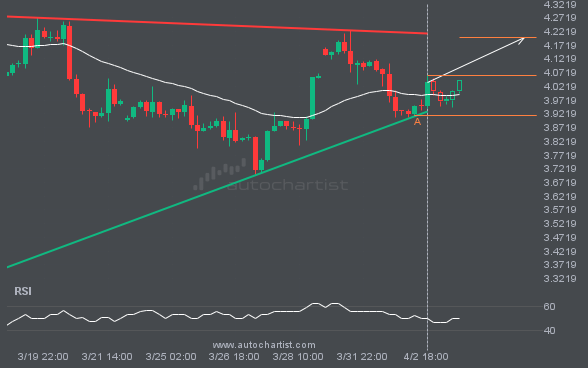
A Triangle pattern was identified on NGC/USD at 4.0625, creating an expectation that it may move to the resistance line at 4.1999. It may break through that line and continue the bullish trend or it may reverse from that line.
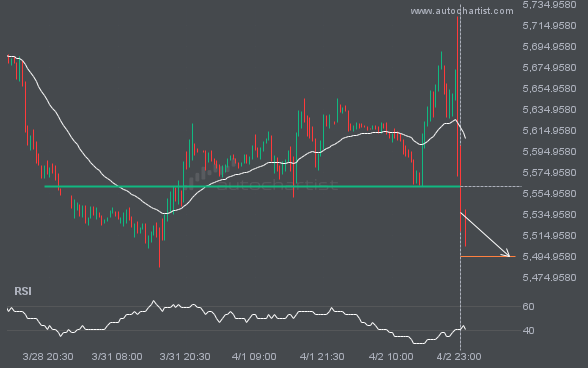
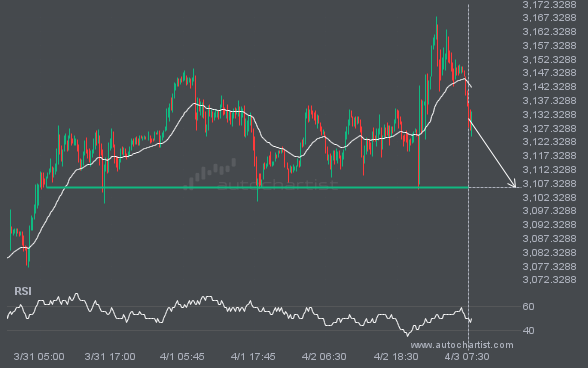
S&P500 has broken through a support line. It has touched this line numerous times in the last 6 days. This breakout shows a potential move to 5494.8921 within the next 17 hours. Because we have seen it retrace from this level in the past, one should wait for confirmation of the breakout.
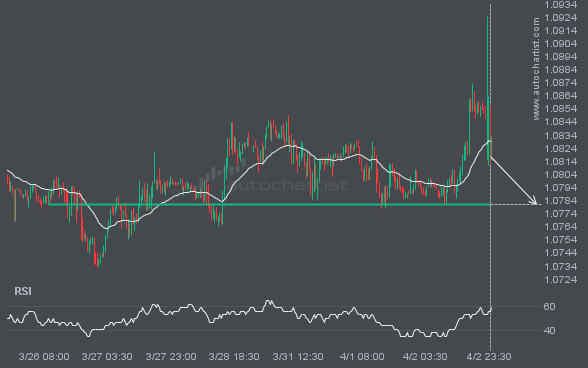
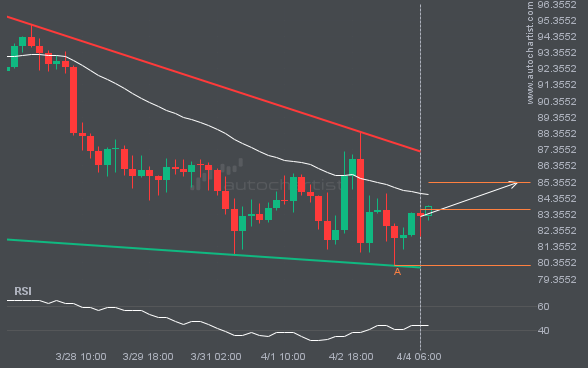
The price of EURUSD in heading back to the support area. It is possible that it will struggle to break through it and move back in the other direction. The price may eventually break through, but typically the price retreats from the level a number of times before doing so.
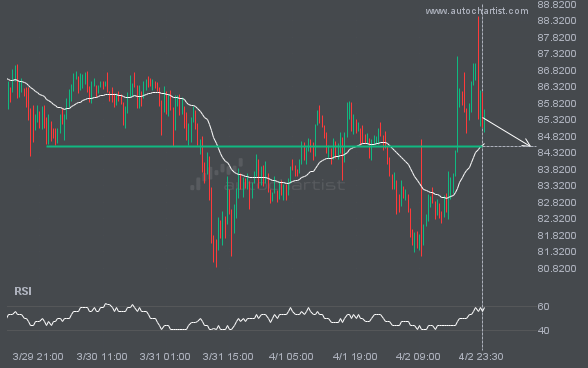
The price of LTCUSD in heading back to the support area. It is possible that it will struggle to break through it and move back in the other direction. The price may eventually break through, but typically the price retreats from the level a number of times before doing so.