Skip to content
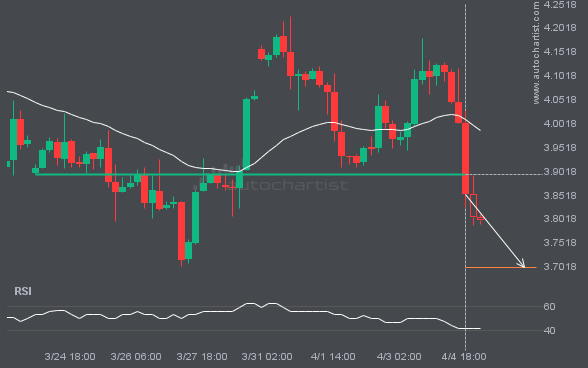
 NGC/USD is once again retesting a key horizontal support level at 3.8940. It has tested this level 4 times in the recent past and could simply bounce off like it did last time. However, after this many tries, maybe it’s ready to start a new trend.
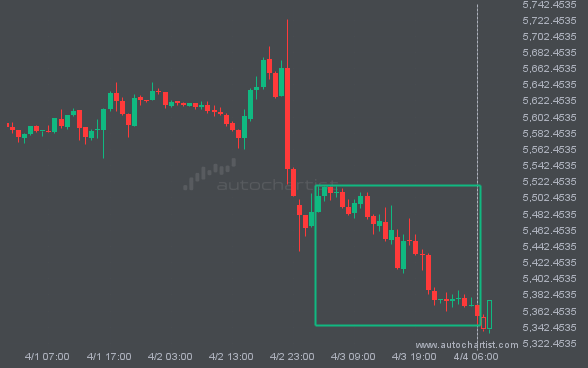
Those of you that are trend followers are probably eagerly watching LTCUSD to see if its latest 14.14% move continues. If not, the mean-reversion people out there will be delighted with this exceptionally large 20 hours move.
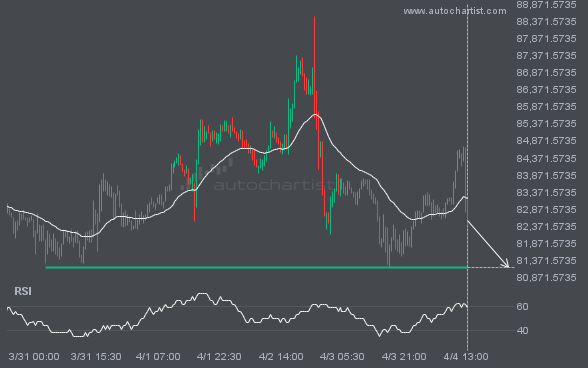
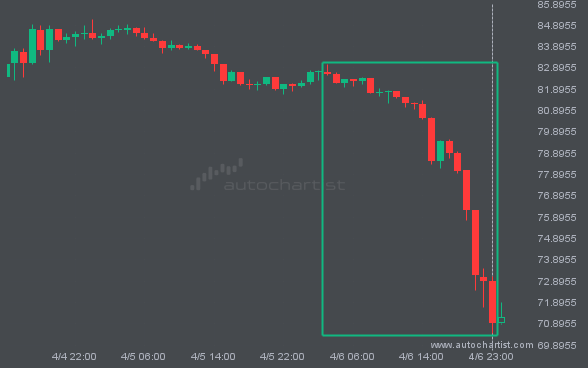
The movement of BTCUSD towards 81178.5703 price line is yet another test of the line it reached numerous times in the past. We could expect this test to happen in the next 2 days, but it is uncertain whether it will result in a breakout through this line, or simply rebound back to current lines.
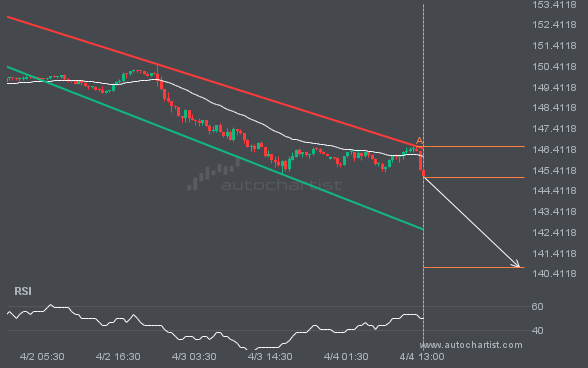
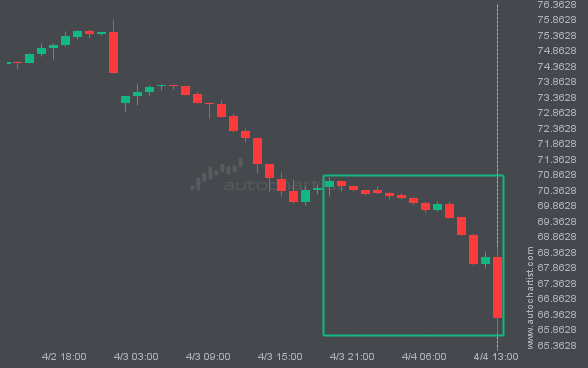
USDJPY is moving towards a support line. Because we have seen it retrace from this line before, we could see either a break through this line, or a rebound back to current levels. It has touched this line numerous times in the last 3 days and may test it again within the next 18 hours.
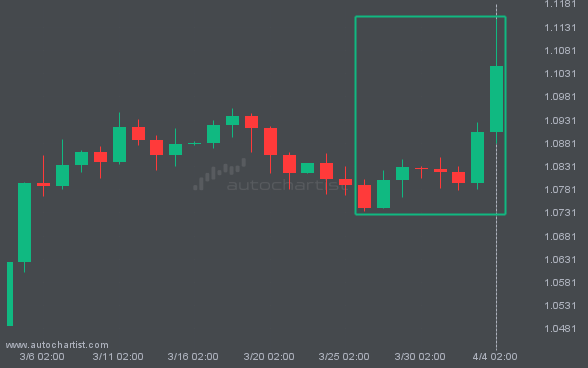
For those of you that don’t believe in trends, this may be an opportunity to take advantage of an exceptional 2.83% move on EURUSD. The movement has happened over the last 10 days. For those trend followers among you, you may think about riding this possible trend.