Skip to content
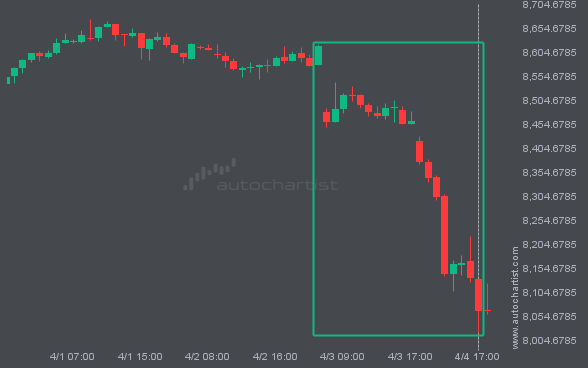
 For those of you that don’t believe in trends, this may be an opportunity to take advantage of an exceptional 12.83% move on LTCUSD. The movement has happened over the last 22 hours. For those trend followers among you, you may think about riding this possible trend.
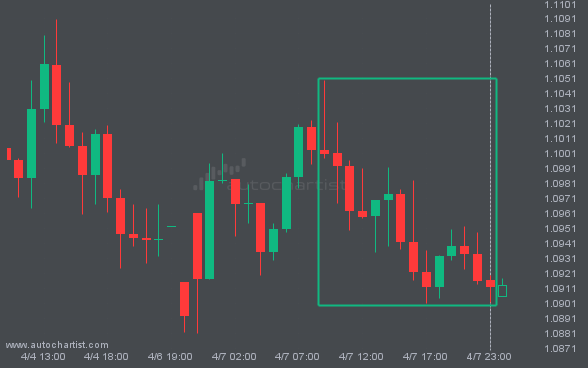
For those of you that don’t believe in trends, this may be an opportunity to take advantage of an exceptional 0.81% move on EURUSD. The movement has happened over the last 14 hours. For those trend followers among you, you may think about riding this possible trend.
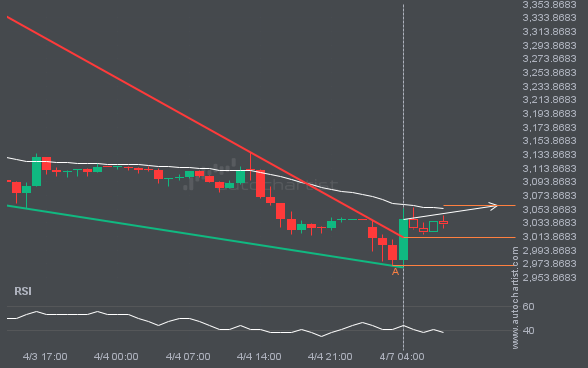
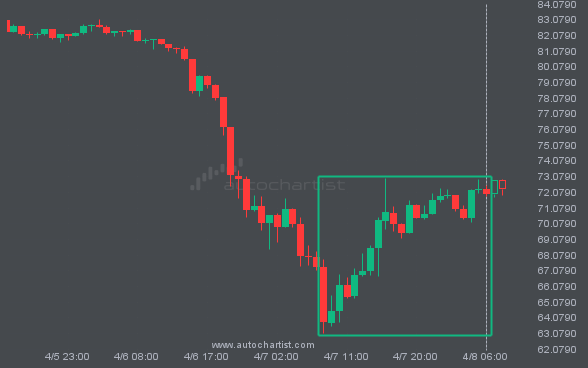
XAUUSD has broken through a resistance line of a Falling Wedge and suggests a possible movement to 3058.6232 within the next 7 hours. It has tested this line in the past, so one should probably wait for a confirmation of this breakout before taking action. If the breakout doesn’t confirm, we could see a retracement […]
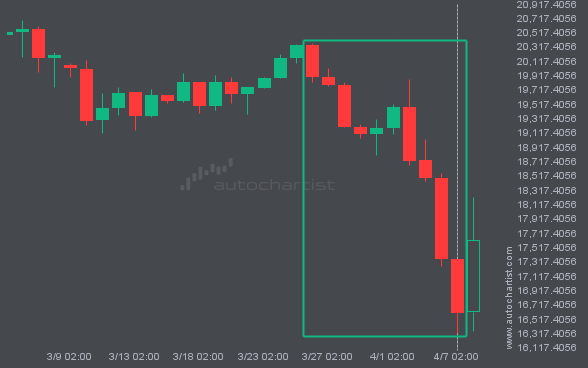
Those of you that are trend followers are probably eagerly watching ETHUSD to see if its latest 24.11% move continues. If not, the mean-reversion people out there will be delighted with this exceptionally large 15 days move.
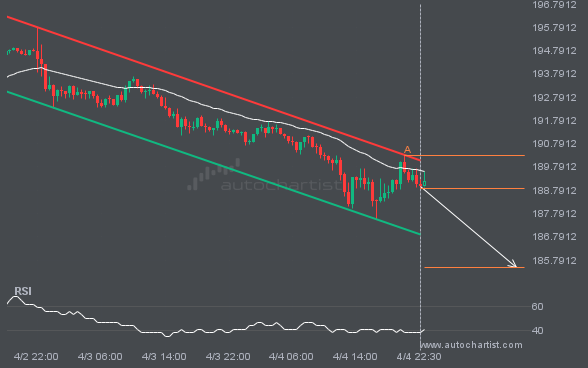
An emerging Channel Down has been detected on GBPJPY on the 30 Minutes chart. There is a possible move towards 185.4714 next few candles. Once reaching resistance it may continue its bearish run or reverse back to current price levels.