Skip to content
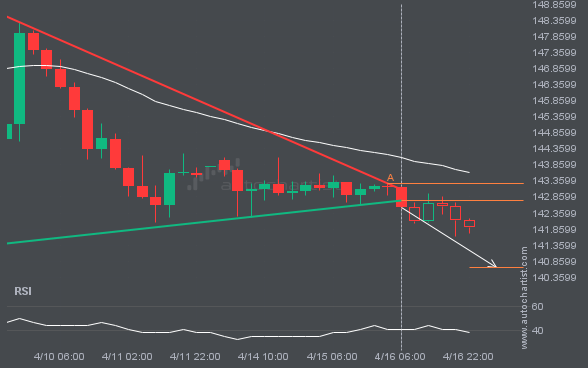
 USDJPY has broken through a support line of a Triangle chart pattern. If this breakout holds true, we may see the price of USDJPY testing 140.6664 within the next 15 hours. But don’t be so quick to trade, it has tested this line in the past, so you should confirm the breakout before taking any […]
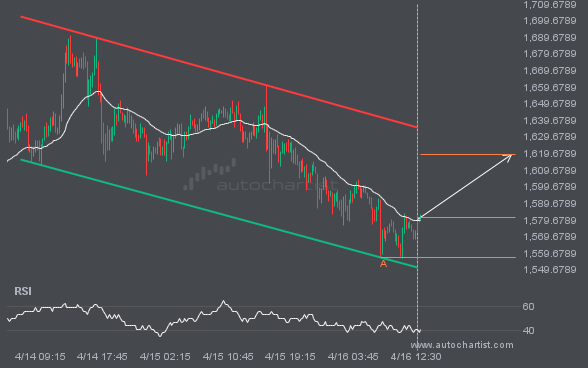
ETHUSD was identified at around 1581.45 having recently rebounded of the support on the 15 Minutes data interval. Ultimately, the price action of the stock has formed a Channel Down pattern. This squeeze may increases the chances of a strong breakout. The projected movement will potentially take the price to around the 1619.4099 level.

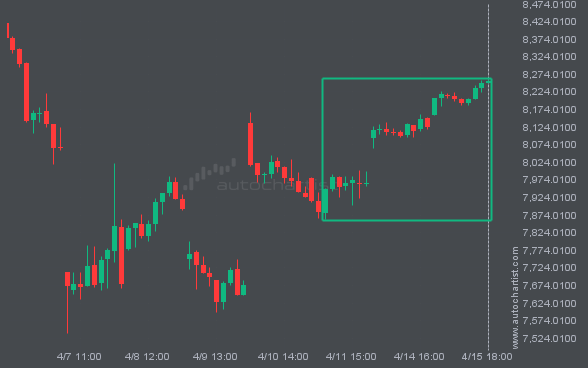
S&P500 is moving towards a line of 5516.8198 which it has tested numerous times in the past. We have seen it retrace from this position in the past, so at this stage it isn’t clear whether it will breach this price or rebound as it did before. If S&P500 continues in its current trajectory, we […]

The breakout of EURUSD through the 1.1370 price line is a breach of an important psychological price that is has tested numerous in the past. If this breakout persists, EURUSD could test 1.1417 within the next 9 hours. One should always be cautious before placing a trade, wait for confirmation of the breakout.
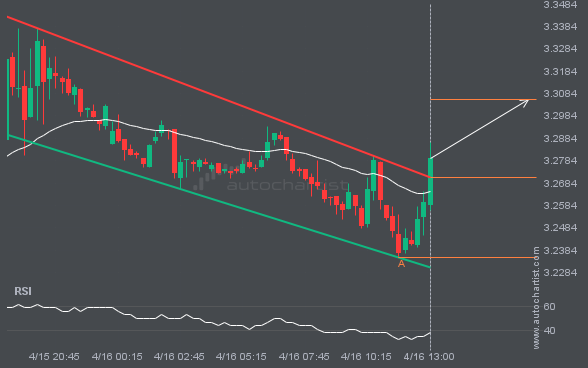
NGC/USD has broken through a resistance line of a Channel Down chart pattern. If this breakout holds true, we may see the price of NGC/USD testing 3.3055 within the next 5 hours. But don’t be so quick to trade, it has tested this line in the past, so you should confirm the breakout before taking […]
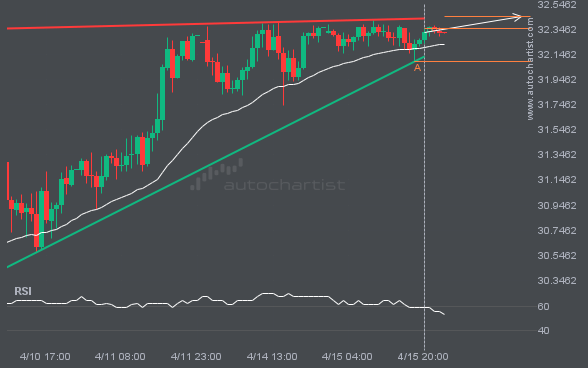
XAGUSD was identified at around 32.353 having recently rebounded of the support on the 1 hour data interval. Ultimately, the price action of the stock has formed a Ascending Triangle pattern. This squeeze may increases the chances of a strong breakout. The projected movement will potentially take the price to around the 32.4463 level.