Skip to content
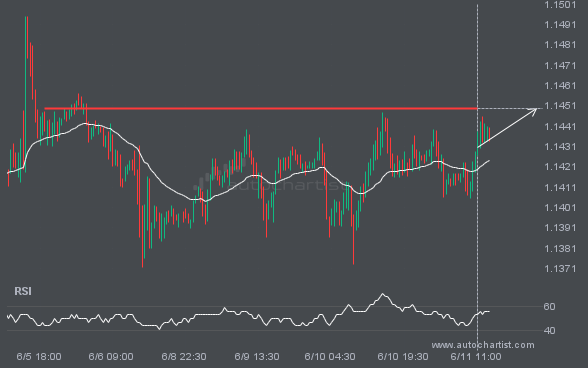
 BTCUSD is trapped in a Falling Wedge formation, implying that a breakout is Imminent. This is a great trade-setup for both trend and swing traders. It is now approaching a resistance line that has been tested in the past. Divergence opportunists may be very optimistic about a possible breakout and this may be the start […]
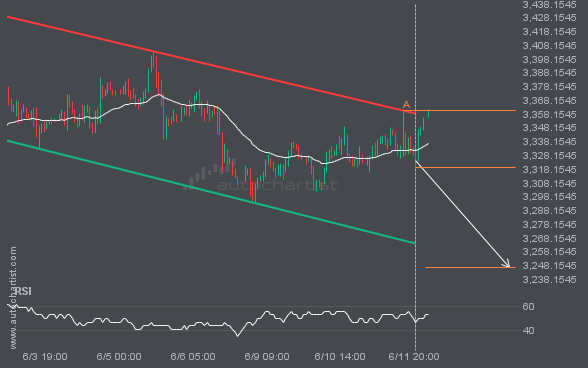
The movement of XAUUSD towards the support line of a Channel Down is yet another test of the line it reached numerous times in the past. This line test could happen in the next 2 days, but it is uncertain whether it will result in a breakout through this line, or simply rebound back to […]

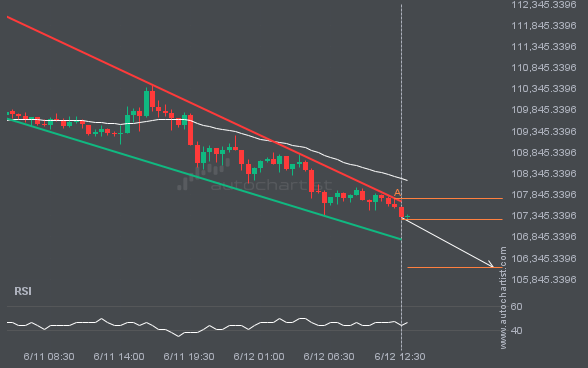
This trade setup on LTCUSD is formed by a period of consolidation; a period in which the price primarily moves sideways before choosing a new direction for the longer term. Because of the bearish breakout through support, it seems to suggest that we could see the next price move to 89.7994.
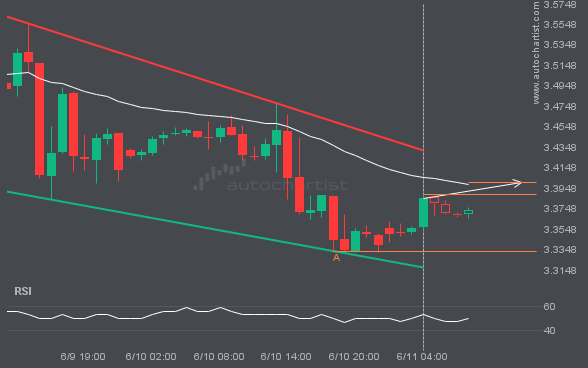
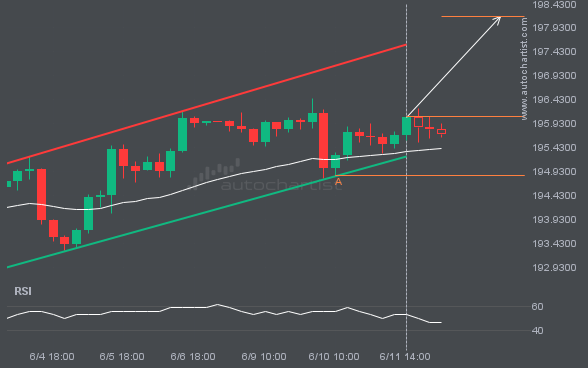
NGC/USD is approaching the resistance line of a Channel Down. It has touched this line numerous times in the last 5 days. If it tests this line again, it should do so in the next 7 hours.