Skip to content
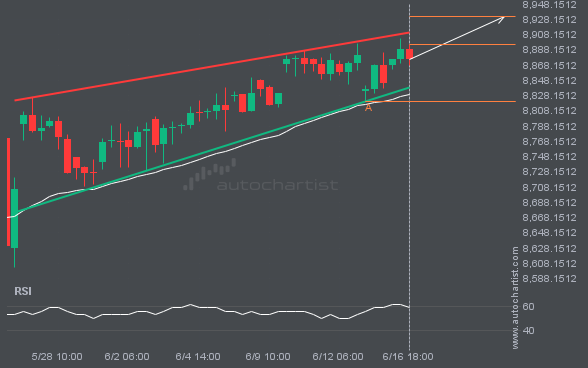
 The movement of FTSE100 towards the resistance line of a Rising Wedge is yet another test of the line it reached numerous times in the past. This line test could happen in the next 3 days, but it is uncertain whether it will result in a breakout through this line, or simply rebound back to […]
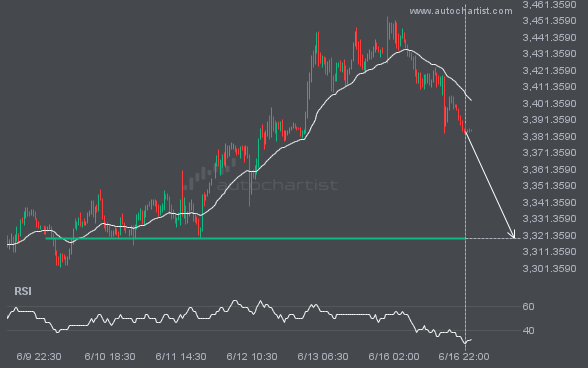
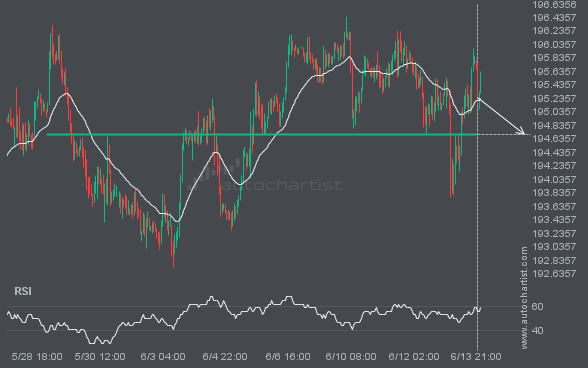
XAUUSD is moving towards a line of 3319.4355 which it has tested numerous times in the past. We have seen it retrace from this position in the past, so at this stage it isn’t clear whether it will breach this price or rebound as it did before. If XAUUSD continues in its current trajectory, we […]
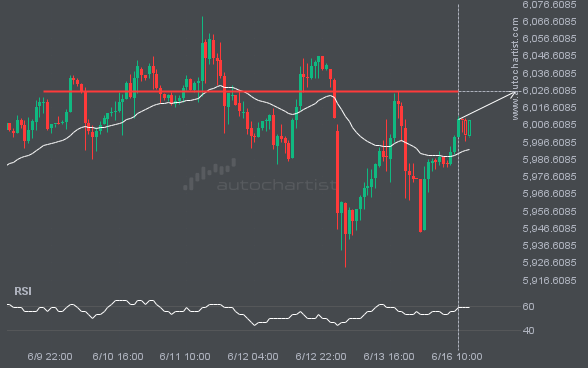
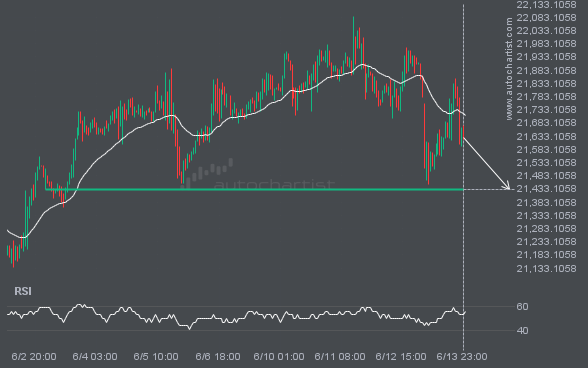
The movement of S&P500 towards 6025.8701 price line is yet another test of the line it reached numerous times in the past. We could expect this test to happen in the next 23 hours, but it is uncertain whether it will result in a breakout through this line, or simply rebound back to current lines.

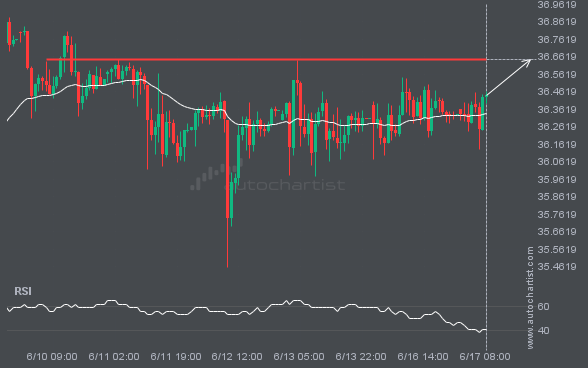
Emerging Triangle detected on USDJPY – the pattern is an emerging one and has not yet broken through support, but the price is expected to move up over the next few hours. The price at the time the pattern was found was 144.152 and it is expected to move to 144.9927.