 Skip to content
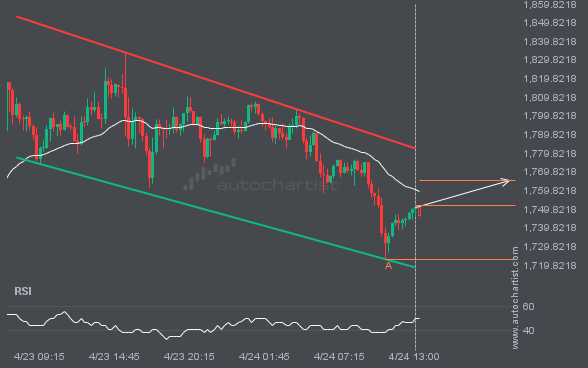
 ETHUSD is moving towards a resistance line which it has tested numerous times in the past. We have seen it retrace from this line before, so at this stage it isn’t clear whether it will breach this line or rebound as it did before. If ETHUSD continues in its current trajectory, we could see it […]
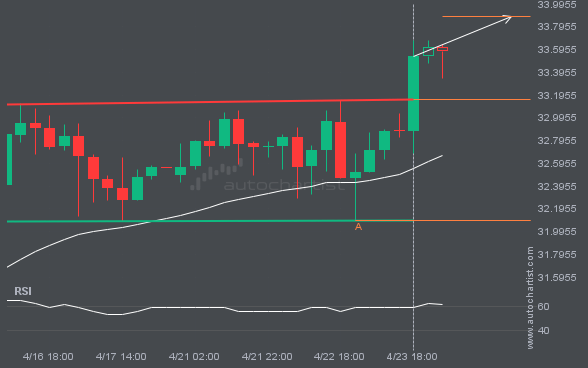
You would be well advised to confirm the breakout that has just occurred – do you believe the move through resistance to be significant? Do you have confirming indicators that the price momentum will continue? If so, look for a target of 33.8852 but consider reducing the size of your position as the price gets […]
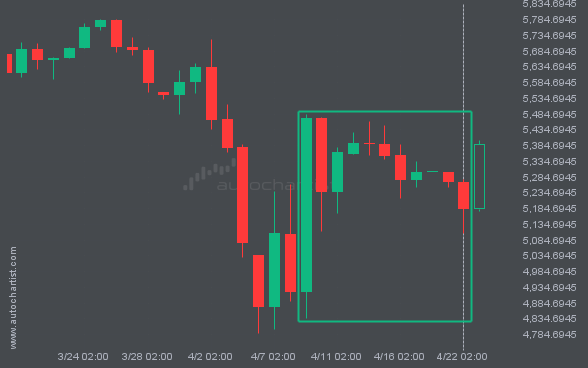
S&P500 dropped sharply for 13 days – which is an excessively big movement for this instrument; exceeding the 98% of past price moves. Even if this move is a sign of a new trend in S&P500 there is a chance that we will witness a correction, no matter how brief.
LTCUSD is approaching the support line of a Channel Up. It has touched this line numerous times in the last 7 days. If it tests this line again, it should do so in the next 2 days.
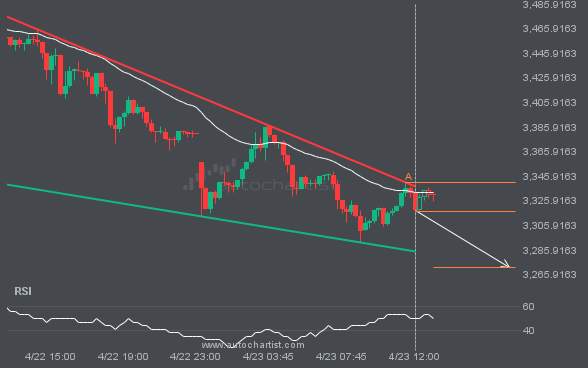
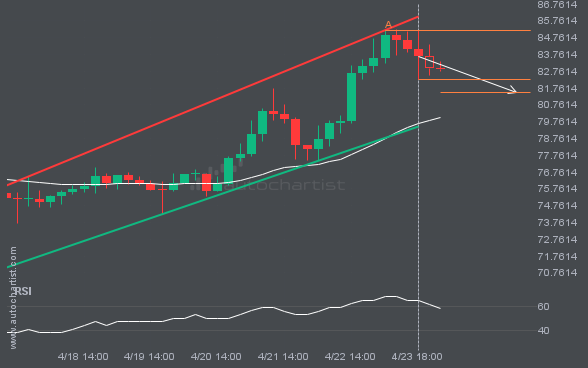
Emerging Falling Wedge pattern in its final wave was identified on the XAUUSD 15 Minutes chart. After a strong bearish run, we find XAUUSD heading towards the upper triangle line with a possible resistance at 3271.7274. If the support shows to hold, the Falling Wedge pattern suggests a rebound back towards current levels.
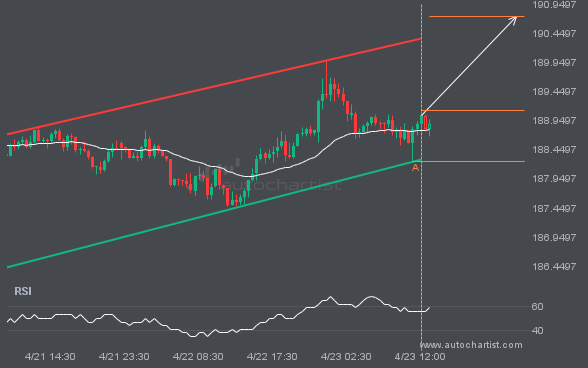
Emerging Channel Up pattern in its final wave was identified on the GBPJPY 30 Minutes chart. After a strong bullish run, we find GBPJPY heading towards the upper triangle line with a possible resistance at 190.7346. If the resistance shows to hold, the Channel Up pattern suggests a rebound back towards current levels.
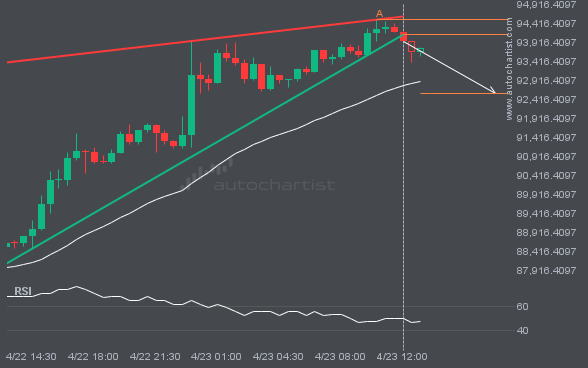
Rising Wedge pattern identified on BTCUSD has broken through a support level with the price momentum continuing to move in an downward direction. A solid trading opportunity continues with the price expected to reach 92571.8470 in the next 5.

